After browsing this page, you might be interested in reading how Central banking and haute finance have grown at the expense of the people.
..: Updated Weekly :..
Shortcuts to: Balance Sheet and Fed's holdings - UST holders - Money Supply and monetary policy - Money velocity - U.S. gov bonds rates - Measures of the confidence in the US Dollar international status
______________________________
The United States Federal Reserve's unofficial Dashboard

1. U.S. Federal Reserve's balance sheet
Fed's balance sheet
- Let's start by M3:

Source: nowandfutures.com; updated weekly

- The total factors supplying Reserve Funds (WTFSRFA) reached over US$ 4.3 trillion April 2014, for the first time ever:

Updated weekly
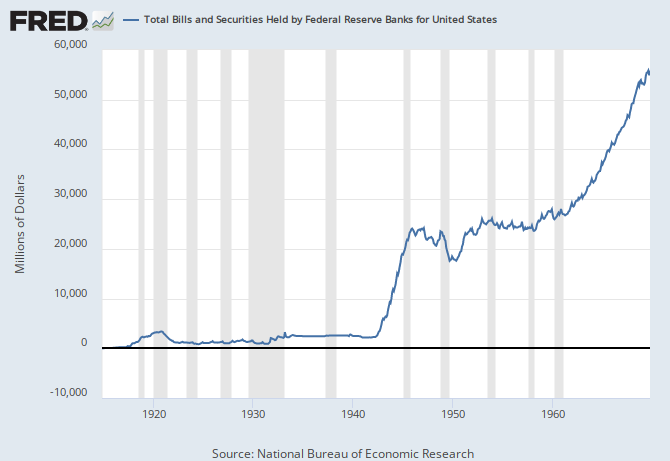
- We are monitoring 'Securities Held Outright' (WSECOUT) serie (blue line below) as a proxy of the total factors supplying Reserve Funds (WTFSRFA) in the official balance sheet:

Updated weekly
WSECOUT is the amount of securities held by Federal Reserve Banks. This quantity is the cumulative result of permanent open market operations: outright purchases or sales of securities.
In April 2014, WSECOUT reached over US$ 4.0 trillion (lhs, blue line above) for the first time ever. Its share (rhs, red line) is back above 90% of the total factors supplying Reserve Funds.
- Federal debt held by Fed over Reserve Bank Credit, in % :

SA; updated weekly
- Reserve Balances with Federal Reserve Banks (WRESBAL):

Updated weekly
This balance is the difference between series WTFSRFA (total factors supplying Reserve Funds) and WTFORBAFA (total factors absorbing Reserve funds). It reached US$ 2.6 trillion Feb. 2014 for the first time ever. You can also browse WRBWFRBL or WLODLL series since 12/2002.
- Ratio of Total Securities Held Outright to the Reserve Balances as defined above:

"Total Securities Held Outright to the Reserve Balances with Fed ratio" (lhs), compared to the "Reserve Balances with Fed to total factors supplying Reserve Funds ratio" (rhs);
Data series since 1989; Updated weekly
- Summary of main aggregates in the Fed balance sheet :

Updated weekly
- How much is the Fed attempting to drain from money supply via reverse repos :

All maturities; data series since 12/2002; updated weekly

idem, 5Y moving

Data serie since 1997; source: nowandfutures.com

The most critical components of the official Fed's balance sheet are monitored below.
Fed's holding of Federal Public Debt

Data series since 1952 and 1970; updated yearly and quarterly
- Fed's SOMA components :

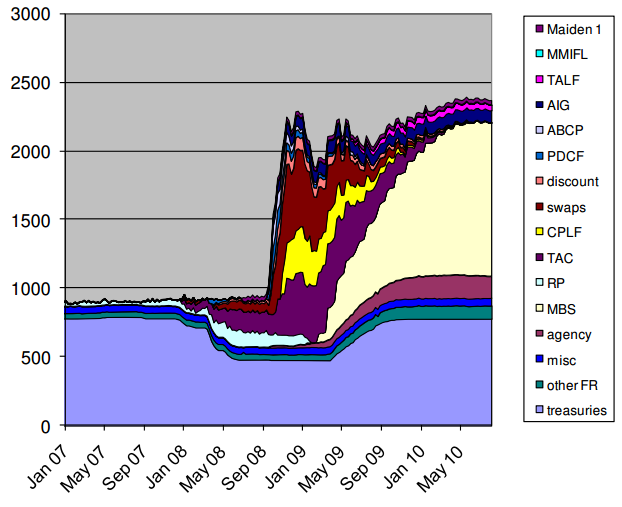
- Fed's holding of U.S. Treasury

Data series between 01/2007 and 12/2012
Fed's holding of U.S. Agency Securities and Mortgage-Based Securities
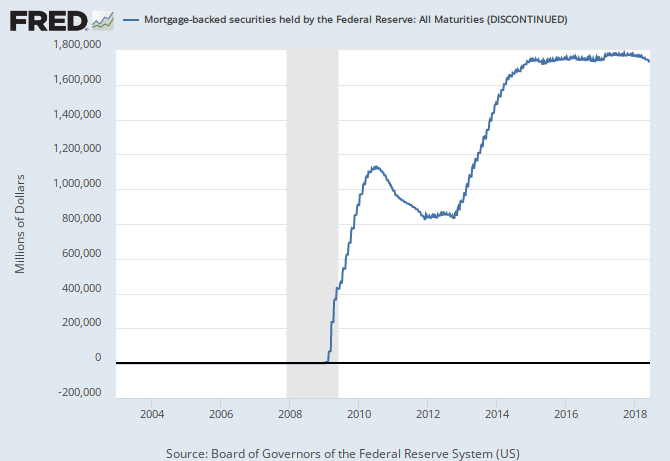
Updated weekly

Updated weekly
Agency securities are liabilities of U.S. government agencies or U.S. government-sponsored enterprises (Fannie Mae, Ginnie Mae, Freddie Mac).
- MBS and Agencies held by commercial banks
1.1. The Holders of U.S. Treasury securities
- U.S. Treasury securities held by the Federal Reserve, All Maturities : US$ 2.27 trillion
Updated weekly
- U.S. Treasury held by the Fed, by maturity [blue: maturing in over 10Y; red: over 5Y to 10Y; green: over 1Y to 5Y; orange: over 3M to 1Y; violet: over 15d to 3M; grey: up to 15d] over U.S. Treasury (all maturities), in % :

Data series since 2002 ; updated weekly
- Net acquisition of financial assets and total liabilities held by households :
1990-Q3 2009; Data series with 4Q moving average
- U.S. Treasury held by households and foreign sector :
1999-Q3 2009; Data series with 3Q moving average
UST Holding by Fed and international investors
- 1) U.S. Treasury (TREAST) or Federal Debt held by federal reserve banks (FDHBFRBN) over Federal Debt Held by Public (FYGFDPUN) :

share in %; updated quarterly
We consider the Federal Debt Held by Public to be a good proxy of the total amount of U.S. Treasury available on the US Treasury bond "market", because others issued debt securities are non marketable (look for FDHBATN in U.S. Debt page). This percentage measures the part held by the Fed of all available US Treasury bonds, in notional value only.
- 2) Green line: Federal Debt held by Foreign & International Investors (FDHBFIN) over Federal Debt Held by Public (FYGFDPUN)


in %; Data series since 1970;
updated quarterly; red and blue lines as defined above
Conclusion : Investors in foreign countries are holding currently around 45%, slowly decreasing share of all available U.S. Treasury bonds (all maturities), and U.S. Federal Reserve is holding around 20% (in notional value).
The breakdown for each country is discussed here.
The breakdown for each country is discussed here.
Using a different approach, Stone & McCarthy found in September 2012 that the Fed owns 27% of all UST duration (the entire UST inventory in outstanding ten-year equivalents), rising at over 10% per year, and this is indeed crucial because when it comes to defining risk exposure in the bond market, and therefore in equities, all that matters is duration, expressed in terms of ten-year equivalents.
(Note: A Treasury security expressed in ten‐year equivalents is the par value of security times the duration of security divided by the duration of the on‐the‐run ten year Treasury note.)
Others holders of U.S. Treasury securities
The remaining part is held by many different US-based funds, commercial financial sector and the household sector, which includes U.S. hedge funds, private equity funds and personal trusts...


For the last figures, read the last Flow of Funds quarterly report:


%2Ca%2F(b%2F1000)%2Ca%2F(b%2F1000)&fgst=lin%2Clin%2Clin&fq=Weekly%2C+Ending+Wednesday%2CMonthly%2CQuarterly&fam=avg%2Cavg%2Cavg&vintage_date=%2C%2C&revision_date=%2C%2C)


This velocity is calculated as the ratio of nominal GDP to the quarterly average of money stock.


- % Ownership of U.S. Treasury and U.S. Agencies Debt, 1960 - 2011 :
Source: Forbes.com


For the last figures, read the last Flow of Funds quarterly report:
- tables F.209 & L.209 "Treasury securities" and table L.100 "Households and Nonprofit Organizations" before 2015 Q2 report :

L.209: Holdings of UST, between 2007 and 2013 Q1
- tables F.210 & L.210 "Treasury securities" starting with 2015 Q2 report :


L.210: Holdings of UST, between 2010 and 2015 Q2
The biggest UST holders were in 2012 Q4 :
- Rest of the world -- Official institutions : 34.5% of UST shares (in notional value)
- Fed (not including SSTF special issues, see here note 2) : 14.4%
- Rest of the world -- Private investors (i.e. foreign hedge funds) : 13.4%
- Household sector, not including Savings Bonds -- (i.e. domestic hedge funds, private eq. funds) : 7.4%
- Money market mutual funds : 4.0%
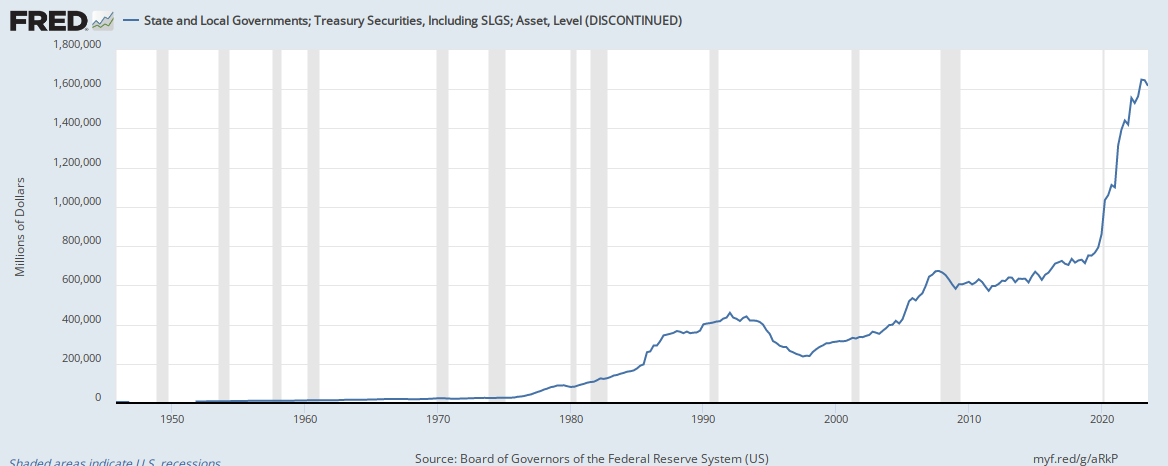
- State and local gov. : 1.9%
- Fed : +6.9% (this is not a surprise)
- Household sector, not including Savings Bonds : +6.8%
- Rest of the world -- Official institutions : -3.4%
- State and local gov. retirement funds : -4.2%
- Money market mutual funds : -5.2%
Treasury securities (UST) held...


Total credit market instruments assets, debt securities and UST held...
Total credit market (TCM) instruments is strictly defined by the sum Commercial paper + Treasury securities + Agency- and GSE-backed securities + Municipal securities + Mortgages + Consumer credit.
On 09/21/2015 for 2015 Q2 data release, Fed discontinued the data series below about TCM instruments assets holdings. I replaced them with debt securities assets holdings when available. Debt securities (tables F/L 208) include open market paper, Treasury securities, agency- and GSE-backed securities, municipal securities, and corporate and foreign bonds.
At the same time, China was selling hundreds of $ billions of UST, reportedly bought by so-called "US. funds".

Breakdown by holders : Total credit market instruments, debt securities and UST assets held...


On 09/21/2015 for 2015 Q2 data release, Fed discontinued the data series below about TCM instruments assets holdings. I replaced them with debt securities assets holdings when available. Debt securities (tables F/L 208) include open market paper, Treasury securities, agency- and GSE-backed securities, municipal securities, and corporate and foreign bonds.
At the same time, China was selling hundreds of $ billions of UST, reportedly bought by so-called "US. funds".
Data series updated quarterly.
Breakdown by holders : Total credit market instruments, debt securities and UST assets held...
- ...by financial business:
- ...by Foreign sector - Rest of the World (data serie from Z1 Flow of funds, table L1):
In 2012 Q4, the U.S. Treasury share was 57.5% of the total Credit market instruments assets owned by this group. The UST amount for this group was (source: Z1 flow of funds report):
Total treasury securities: US$ 5545.5 bn, including:
* Official institutions: $ 3991.8 bn
* Private investors: $ 1553.8 bn
- ...by GSE :
debt securities and loans ; source
debt securities only ; source
In 2012 Q4, the U.S. Treasury share was 0.9% of the total Credit market instruments assets owned by these institutions. (source: Z1 flow of funds report)
- ...by Mutual Funds :
- ...by Domestic Nonfinancial Sectors :
- ...by U.S. Federal Reserve :
(discontinued)

Assets of Federal Reserve Banks and Treasury monetary accounts that supply or absorb bank reserves. Excludes the accounts of the Federal Reserve Board.
In 2012 Q4, the UST share was 62.4% of the total Credit market instruments assets owned by these institutions. (source: Z1 flow of funds report)

- ...by household :
This sector includes domestic hedge funds, private equity funds, and personal trusts.
In 2012 Q4, the UST share was 19.8% of the total Credit market instruments assets owned by this group. (source: Z1 flow of funds report)
In 2012 Q4, the UST share was 0% of the total Credit market instruments assets owned by these institutions. (source: Z1 flow of funds report)
- ...by federal, state and local governments :
(discontinued)
For state and local governments: in 2012 Q4, the UST share was 41.3% of the total Credit market instruments assets owned by these institutions.
For Federal government: in 2012 Q4, the UST share is 0%. (source: Z1 flow of funds report)
- ...by money market mutual funds :
In 2012 Q4, the UST share was 29.0% of the total Credit market instruments assets owned by these institutions. (source: Z1 flow of funds report)
(discontinued)
In 2012 Q4, the UST share was 0% of the total Credit market instruments assets owned by these institutions. (source: Z1 flow of funds report)
- ...by ABS issuers :
(discontinued)
In 2012 Q4, the UST share was 1.1% of the total Credit market instruments assets owned by these institutions. (source: Z1 flow of funds report)
(discontinued)
For Private pension funds: in 2012 Q4, the UST share was 40.6% of the total Credit market instruments assets owned by these institutions.
For state and local retirement funds: in 2012 Q4, the UST share was 28.2%.
For Federal retirement funds: in 2012 Q4, the UST share was 91.2%. (source: Z1 flow of funds report)
- ...by foreign banking offices in U.S. :
(discontinued)
In 2012 Q4, the UST share was 9.9% of the total Credit market instruments assets owned by these institutions. (source: Z1 flow of funds report)
- ...by Real estate investment trusts (REITs) :
(discontinued)

- ...by Fed's Brokers and Dealers banks :
In 2012 Q4, the UST share was 37.8% of the total Credit market instruments assets owned by these institutions. (source: Z1 flow of funds report)
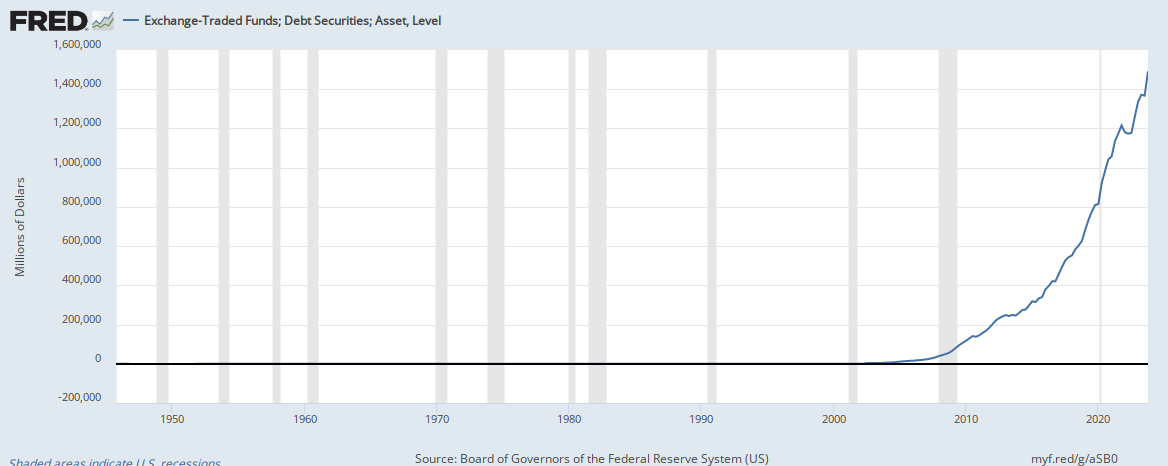
- ...by ETF :
In 2012 Q4, the UST share was 27.5% of the total Credit market instruments assets owned by these institutions. (source: Z1 flow of funds report)
- ...by Credit unions :
- ...by funding corporations:
(discontinued)
In 2012 Q4, the UST share was 23.8% of the total Credit market instruments assets owned by these institutions. (source: Z1 flow of funds report)
- ...by closed-end funds:
2. Money Supply and Fed's monetary policy
- QE1: In November 2008 the Fed announced it would buy up to $600 billion in agency mortgage-backed securities (MBS) and agency debt. On December 16, the program was formally launched. The program was extended in March 2009 by an additional $750 billion MBS, and $300 billion in purchases of Treasury securities. That program concluded in March 2010.
- QE2 started in November 2010 ($600 billion of UST) at a rate of $75 billion per month. That program concluded in June 2011.
- Operation Twist Redux: The first part of the maturity-extension program was announced Sept. 21, 2011 and expired in June 2012. Under that program, the Fed was selling $400 billion of short-term government debt and replacing it with the same amount of longer-term Treasuries. In June 2012, the Fed announced the extension of the program: it will sell Treasury securities with remaining maturities of about three years or less. It will purchase securities with 6 years to 30 years remaining by adding additionally $267 billion thereby extending it throughout 2012.
- QE3 started in September 2012 ($40 billion of MBS per month "until the labor market improves substantially"). Additionally on December 12, 2012 the FOMC authorized up to $40 billion worth of MBS per month, and $45 billion worth of longer-term Treasury securities. That program concluded in October 2014.
What will be the effect of QE3 extension actions on the average duration of the SOMA’s Treasury holdings?
The duration of the Treasury securities held in the SOMA portfolio will increase from approximately 5 years at the beginning of the maturity extension program in September 2011 to approximately 8 years by the end of December 2012.
How does the maturity extension program compare to the asset purchase program that ended in June 2011?
The long-term Treasury securities purchased under the maturity extension program are expected to have an average duration of about 10 to 11 years, while the securities sold or redeemed under the program are expected to have an average duration of about 1½ years. The effect of the roughly 9 years difference in duration for the $667 billion maturity extension program is expected to increase the average duration of the entire SOMA Treasury portfolio from 5 to about 8 years at the program’s conclusion.
By comparison, the average duration of the $600 billion in securities purchased from November 2010 through June 2011 (often referred to as QE2) was about 5½ years. That program, which spread purchases across a wide range of maturities, left the average duration of the SOMA Treasury portfolio roughly unchanged at about 5 years.
Another measure, commonly known as "10-year equivalents," captures both the size of the programs and the average duration of the securities being bought and sold or redeemed. This measure is defined as the amount of 10-year Treasury securities that would have an equivalent amount of net duration exposure. By this measure, the maturity extension program is expected to remove roughly $700 billion in 10-year equivalents from the market by the end of 2012, whereas the round of Treasury purchases completed in June 2011 (QE2) removed about $400 billion in 10-year equivalents from the market.
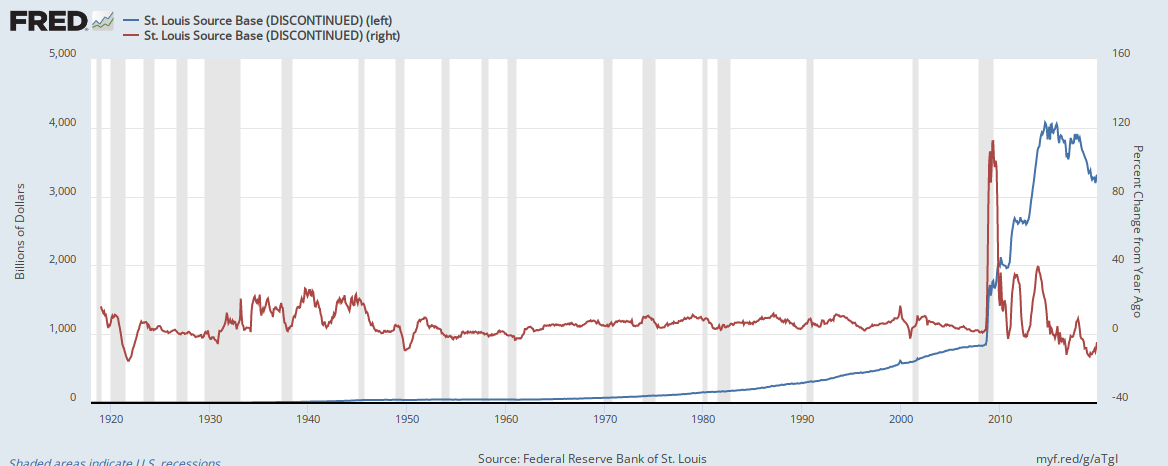
Monthly levels of dollar supply and U.S. monetary base
Austrian or True Money Supply for US, UK, Japan, Eurozone (source, with long term data series)


True Money Supply (Austrian), MZM, M1, M2, M3;
data series 1959-2011; source


Data serie 7Y

Data series 7Y

Data series between 1879 and 2006

Data serie 7Y

Data serie 7Y

Data serie since 1970; source: nowandfutures.com

Total money = M3 + Z1 credit; Data serie since 1970; source: nowandfutures.com

M3 + Z1 credit + gov.debt; Data serie since 2000; source: nowandfutures.com

M3 + Z1 credit + gov.debt; Data series since 1915; source: nowandfutures.com

Data serie since 1981; source: nowandfutures.com

Data serie since 1991; source: nowandfutures.com

Data series from 2000; source: nowandfutures.com
Data series since 1981; Updated weekly
Data series since 1918 ; monthly data
- see also the charts of M1, M2, M3 with logarithmic scaling (% change year to year since 1960)
Interests generated from MZM (create revenues with money)
Data serie since 1982; updated monthly
MZM: Money with zero maturity. It measures the supply of financial assets redeemable at par on demand. Let's assume MZM earns a rate similar to 3-month T-Bills. This chart shows how much interest would be generated (in US$ billion).
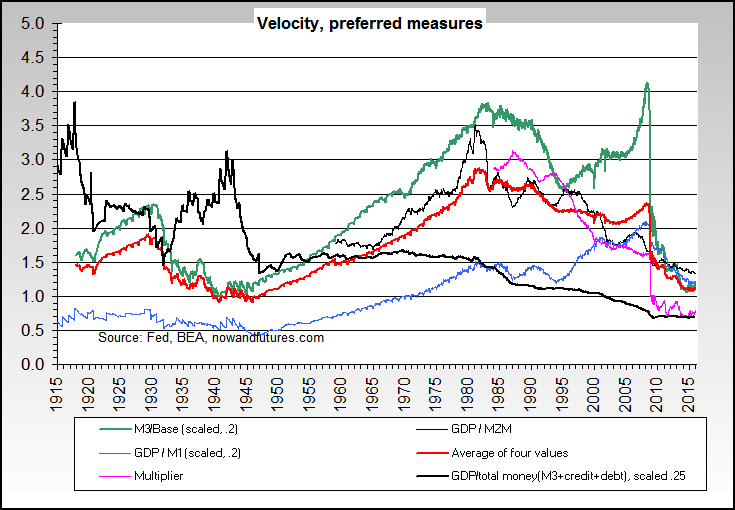
Velocity must also be factored in since it affects the amount of total money in an economic system. Velocity is low in a depression and high in a hyperinflation. Note that velocity is measured in many different ways, and that no single way is adequate to express it at all times.
The monetary base (also base money, money base, M0, high-powered money, reserve money, or, in the UK, narrow money) is defined as the sum of currency circulating in the public and commercial banks' reserves with the central bank.
The monetary base should not be confused with the money supply which consists of currency circulating in the public and non-bank deposits with commercial banks. Normally, the money supply exceeds the monetary base by far; the ratio of the two is referred to as the money multiplier.
M1 money multiplier
Data serie since 1984; updated bi-weekly
MULT is the ratio of M1 money stock (M1SL) to the St Louis Fed Adjusted Monetary Base (AMBSL).
Data serie since 1959; updated monthly
M2 money multiplier: Ratio of M2 money stock to M0
Data serie since 1959; updated weekly
U.S. : M2 / monetary base BoG (lhs, updated monthly and weekly); GDP / monetary base BoG (rhs); data series since 1959 and 1980;
Ratio of GDP to the St Louis Fed Adjusted Monetary Base
U.S. velocity of money
using GDP / StLouis Fed non-adjusted monetary base (lhs, blue and red);
using GDP/M2 money stock (rhs, green and grey);
data series since 1929; updated annually, quarterly and monthly

Velocity of M1, M2, MZM Money Stocks
Data series since 1959
Data serie since 1869
- Securities Lending Transaction Volume; data serie since 2005, updated daily
- TLT ETF (Barclays 20+Year Treasury Bond Fund)

(discontinued)
Data serie since 1952; updated weekly
(discontinued)
WSLB20 - GS10 ; Data serie since 1952; updated weekly

Tax-Exempt Interest rates for large AAA rated municipal issuers, 09/1981 - 09/2012 (source)
1M to 30Y U.S. Treasury Bond yields
FF, DGS1M to DGS2Y; 5Y moving data series; data since 1954; Updated daily
FF, DGS1Y to DGS30Y, TREAST; Data series since 1954; Updated daily
5 to 30-Year Treasury Inflation Indexed rates; Data series since 2003; Updated daily
- 10Y Treasury bond rate, intraday
- US short and long-term interest rates 1798-2012 :

data: MeasuringWorth.com ; chart: conscience-sociale.org
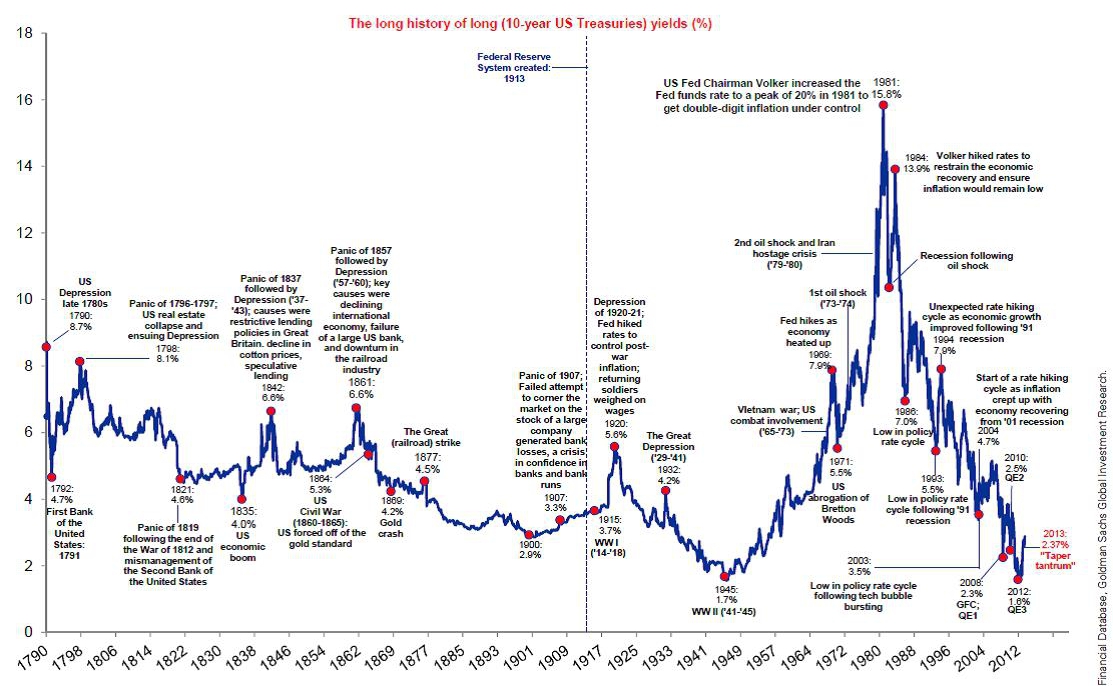
US 10Y bond interest rates 1790-2013 (source)
Bond market break-even inflation Rate
data serie since 2003; updated daily
This measure is defined here as the yield gap between U.S. 10-Year Treasury Constant Maturity Rate and U.S. 10-Year Treasury Inflation-Indexed Security, Constant Maturity rate. It signals traders’ expectations for inflation over the life of the debt. It is termed the ‘break-even’ rate since if future inflation turned out to be equal to this rate then the realised real return from holding a nominal bond and an indexed bond would be exactly the same. If the break-even rate is negative it suggests traders are betting the economy may face deflation in the future.
- 3-Month Treasury Bill rate :
data series since 1934; updated daily
Data serie since 1954, updated daily
- See also this other chart from Yahoo (quarterly data)
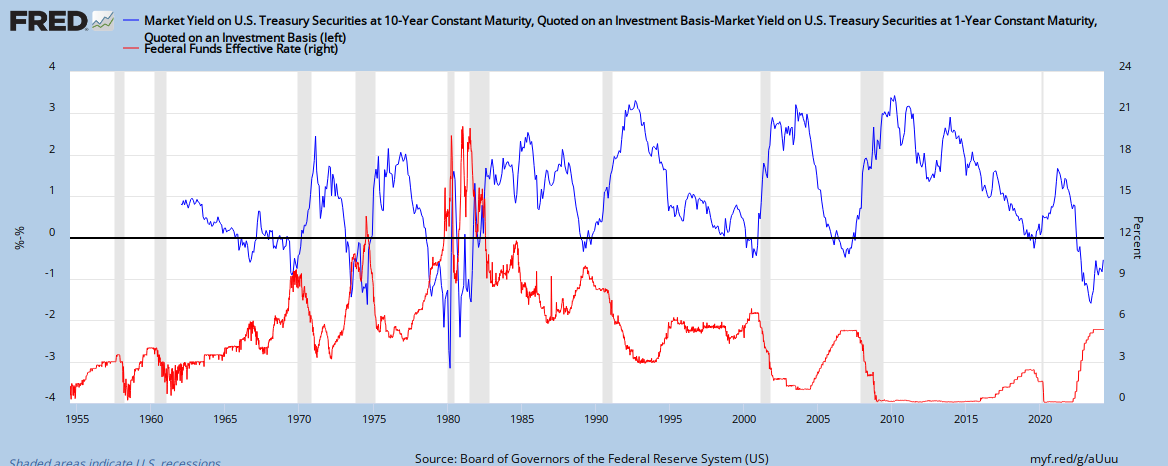
10Y and 1Y US Treasury constant maturity rate
Data serie since 1962; Updated daily
TED Spread
data serie from 1986; updated daily with 1 week lag
- View the TED SPREAD chart at Wikinvest for up to date values
- article
Data series since 1957 (spread is the green line, rhs); updated monthly with 2 months lag
10 Year Treasury Constant Maturity Rate (DGS10) - short duration rates spreads
Updated daily ; Data series since 1962
Spread between 10Y and 1Y Treasury rates (lhs);
Effective Federal Funds Rate (rhs); Updated monthly; data series since 1953
Effectiveness of Fed's policy on the spread of Treasury bonds rates; data series since 1962
The Fed's monetary policy aims to curb down 10Y yield. Red line above (right hand scale) is the percentage of the abovedefined spread over the 10Y rate. It records the efficiency of the Fed's monetary policy: the spread can be high but the red line below 20% : this means the spread represents only a small fraction of the 10Y yield, and that 1Y yield is relatively high. If the spread is high but the red line above 50%, this means the spread represents a significant fraction of the 10Y yield, and that 1Y yield is relatively low.
We have discussed the Fed monetary policy in more details here: La géoéconomie des Bons du Trésor U.S.
Contract Futures on U.S. sovereign debt

Who is currently trading U.S. sovereign debt ?


3. How confident do the foreign central banks feel towards the U.S. dollar ?
- The confidence as measured by custodial accounts :


The gap we can observe in december 2012 comes from the difference between the new data series used and the discontinued ones (see here).
- The confidence as measured by Allocated reserves in USD and Unallocated assets, in COFER official data :

data series using allocated reserves; source


- The confidence of BRICS and emerging countries as measured by COFER data :

--------------------------------
Sources for the charts: Nowandfutures.com ; Federal Reserve of St Louis
Data sources : IMF, Fed, U.S. department of Treasury, BIS
Data sources : IMF, Fed, U.S. department of Treasury, BIS
Aucun commentaire:
Enregistrer un commentaire