You can click on each chart for a better rendering and zooming.
..: Updated Daily :..
Shortcuts to: Remarks - Euroland: yield spreads - Euroland: Bond Yields - Euroland: Key Macroeconomic indicators - 10Y spreads for Euroland and others countries - CDS for sovereign debts - US Credit Default Swaps
__________________________
Key Indicators for the Monetary (or Currency) War
charts and data series
(Tableau de bord du risque financier en zone euro)
0. General Remarks
Note 1 :
The yields shown below are relative to the so-called "secondary market", between any bank or financial institutions, at any time.
In the primary market, central banks are auctioning their debt notes to a small number of selected banks (the primary dealers), at defined times (about every 4 months). The observed yield is always smaller than the current yield on the secondary market, or much much smaller if you take Greece.
Note 2 :
During financial crisis, negative short-term yields on government bonds are a sign of fear among investors. Many of them pulled money out of investments seen as risky, pouring cash into the safest securities they could find. Usually, it is short-term government debt, or gold.
This surge in demand pushes up prices. Yields, which move in the opposite direction, tumble sometimes below zero. Since then, negative yields on short-term government debt have happened somewhat regularly, partly reflecting the shrinking supply of investments that investors see as safe even as U.S. stock markets climb. (Source)
Note 3 :
The financial war against Euro currency during the 2010-2012 period was aimed to break EMU. Its goals were geoeconomical first. I named this a monetary war because monetary policies and financial instruments were heavily used on both sides on an unprecedented scale, and because the sides were strictly delimited by their own currency, like a flag. This war accelerated a lot the birth of a new sovereign country across EMU (i.e. political union), and it is called Euroland since 10 years by L.E.A.P/Europe2020. We have already announced since Sept. 2012 that Euroland has win, and this war is now officially over. But because of the trends we have analyzed, the war zone has just moved elsewhere : look for Japan, US, Israël, UK links in Research Notes menu on the right hand side.1-Government bond yield spreads for Eurozone
FRANCE GERMANY 10-YEAR YIELD SPREAD


5Y data serie till 20121017
SPAIN GERMANY 10-YEAR YIELD SPREAD


5Y data serie till 20121017
ITALY GERMANY 10-YEAR YIELD SPREAD
.jpg)

5Y data serie till 10/17/2012
GREECE GERMANY 10-YEAR YIELD SPREAD
.jpg)

5Y data serie till 10/05/2012
PORTUGAL GERMANY 10-YEAR YIELD SPREAD
.jpg)

5Y data serie till 10/17/2012
EFSF / Germany and France OAT / Germany 10-year bond spreads
data series since 12/2009

data series till 3/15/2014
2-Eurozone: 10Y government bond yields
10-Year government bond yield for eurozone countries, Oct 2009 - Feb 2013
.png/520px-Long-term_interest_rates_(eurozone).png)
Long-term interest rates are secondary market yields of government bonds with maturities of close to ten years. Each eurozone country is mentioned except Estonia.
10-Year government bond yield (US, GER, IT, SP), 1860- July 2012

Greece Government Bond 10 Year acting as benchmark

5Y data serie till 11/26/2012

Data serie since 1998
Spain Govt Bond 10 Year acting as benchmark

Data serie since 1991
Portugal Govt Bond 10 Year acting as benchmark

Data serie since 1994
Italy Govt Bond 10 Year acting as benchmark

Data serie since 1991
German Govt Bond 10 Year

Data serie since 1980
French Govt Bond 10 Year OAT

Data serie since 1985
Contract Futures on France sovereign debt FOAT
- latest prices/quotes (for different maturities)
* chart of its Turbo put certificate 1964N (NL0010112033) proposed by Royal Bank of Scotland (leverage 8.56). Introduced on the market 04/23/2012, this product has been desactivated by RBS 05/31/2012.
Contract Futures on Germany sovereign debt BUND
* Euro-Bund futures : code (FGBL Z2)


Data serie between 4/13/2012 and 11/15/2012 (daily averages)

Data serie between 10/1/2009 and 11/15/2012 (monthly averages)
- see also Futures on Italian Government Bond
Finland Govt Bond 10 Year

Data serie since 1991
Slovenia Govt Bond 10 Year

Data serie since 2007
Slovakia Govt Bond 10 Year

Data serie since 2000
Austria Govt Bond 10 Year

Data serie since 1986
Belgium Govt Bond 10 Year

Data serie since 1989
Netherlands Govt Bond 10 Year

Data serie since 1988
Ireland Govt Bond 10 Year

Data serie since 1984
Euro area AAA government bonds yield curve
AAA-rated euro area central government bonds yield curve, updated daily (spot rates). Animated evolution available using menu on the left [Settings/See animation since...].

1 year cumulative data of Euro area yield curve.
The short term yields became negative only from the first days of July 2012, when ESM became operationnal, one year before the initial target date, and after ECB has lowered its main rate from 1% to 0.75%
[The curve for UST is here]
The graphs about Euribor and EONIA are showing that the main last "market" attack started in June 2012.
10 Year Euro AAA government bond yield (2004-today)
3-Eurozone: key macroeconomic indicators
- Browse our dedicated page for key indicators or the new ECB statistics site.
4-Comparison of 10Y Government bonds yields & spreads for Eurozone and others countries
Government Bond yields - 10 Year Notes - List by Country

- Browse the list of yields by country
- View the interactive map (select the "government bond" option in the menu)
10 year Bond Yields and Spreads
- Daily yield and spreads for euro zone countries against German 10Y bond
- Intraday yield and spreads against Bund and T-Notes for 50 countries
- Bond yields curve and bond spreads for UK, Japan, US, Eurozone
- 10Y bond yield per country :
US:

Data serie since 1912;
See also Futures on U.S. Government Bond and FRED data series about long-term and short-term US Treasury rates.
Japan:

Data serie since 1984;
See also Futures on Japan Government Bond
Switzerland:

Data serie since 1994
UK:

Data serie since 1980;
Sweden:

Data serie since 1987
Denmark :
Data serie since 1983
Iceland :
Data serie since 2003
Hungary :
Data serie since 01/1999
Croatia : 
Data serie since 2008
Czech Rep.
Data serie since 2000
Romania : 
Data serie since 2007
Norway : 
Data serie since 1988
Poland : 
Data serie since 1999
Russia : 
Data serie since 2000
Brazil : 
Data serie since 2006
India : 
Data serie since 1994
China : 
Data serie since 2005
Hong-Kong
Data serie since 1996
South Africa
Data serie since 1997
Australia : 
Data serie since 1969
Turkey : 
Data serie since 2010
Canada : 
Data serie since 1985
South Korea
Data serie since 2000
Israel : 
Data serie since 2002
Vietnam : 
Data serie since 2007
Taïwan : 
Data serie since 1999
Philippines
Data serie since 2001
Pakistan : 
Data serie since 2002
5-CDS for sovereign debts
Credit-default swaps tied to sovereign debt typically fall as investors’ perceptions of creditworthiness rise and increase as they deteriorate.
iTraxx SovX indexes for CDS per geographic zone
EU 10-year CDS spreads

The indices below provide current key data on credit default swaps records registered in the Depository Trust & Clearing Corporation's Trade Information Warehouse. These figures include aggregate gross notional positions for Warehouse records but not aggregate number of contracts (hence noted as Net notional). The notional values are represented as US dollar equivalents using the prevailing foreign exchange rates. Net Notional Values with respect to any single reference entity is the sum of the net protection bought by net buyers (or equivalently net protection sold by net sellers).
Charts following "CDS 5Y" mention are displaying 5 year CDS price for 1 year moving, not the net notional value (this one was available only as a link in the section title, but the link is dead since Bloomberg.com reduced its free content).

5 year data serie till 10/22/2012


U.S. CDS 5Y, price in USD

US 5Y CDS, price in euro; data serie 10/04/2008 - 10/04/2013

US 5Y CDS, price in euro; data serie 01/2008 - 07/2011

US 1Y CDS; data serie 10/2008 - 10/2013; source
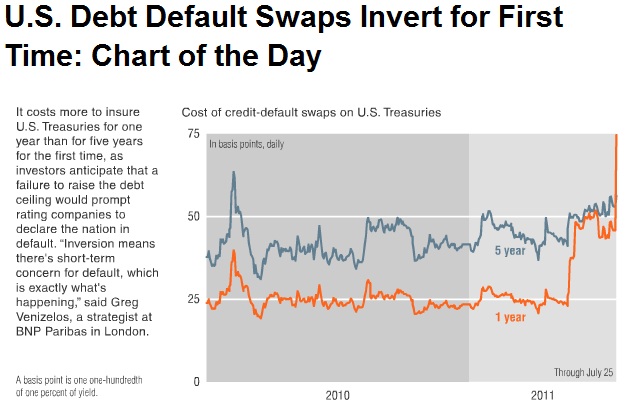
US 1Y and 5Y CDS; data series 01/2010 - 07/2011

data series 01/2008 - 02/2010
US and UK Credit Default Swaps
UK 5Y CDS and US 5Y CDS; data series 04/2007 - 04/2009
Russia Credit Default Swaps
CDS 5Y, price in USD
China Credit Default Swaps
CDS 5Y, price in USD
Brazil Credit Default Swaps
Argentina Credit Default Swaps
Bloomberg.com stopped publishing freely this updated png chart after 03/23/2012 and after 05/09/2012 for some others followed indices below. Then end of 01/2014 they stopped publish any png chart about CDS for sovereign debt.
Cette idée a été ensuite reprise par Discotonio et Olivier Berruyer, voir http://www.les-crises.fr/taux-en-direct/
RépondreSupprimerPour les autres amateurs : c'est mieux quand on cite l'origine...
Since 5 Sept 2012, Bloomberg stopped publishing updated graphs as jpg or flash files for most of the indicators followed here. The URL above only link to 1 year history graphs (snapshots).
RépondreSupprimer