
Who said it's a zombie economy ?
I have analyzed the mathematical trend of these data in another article.
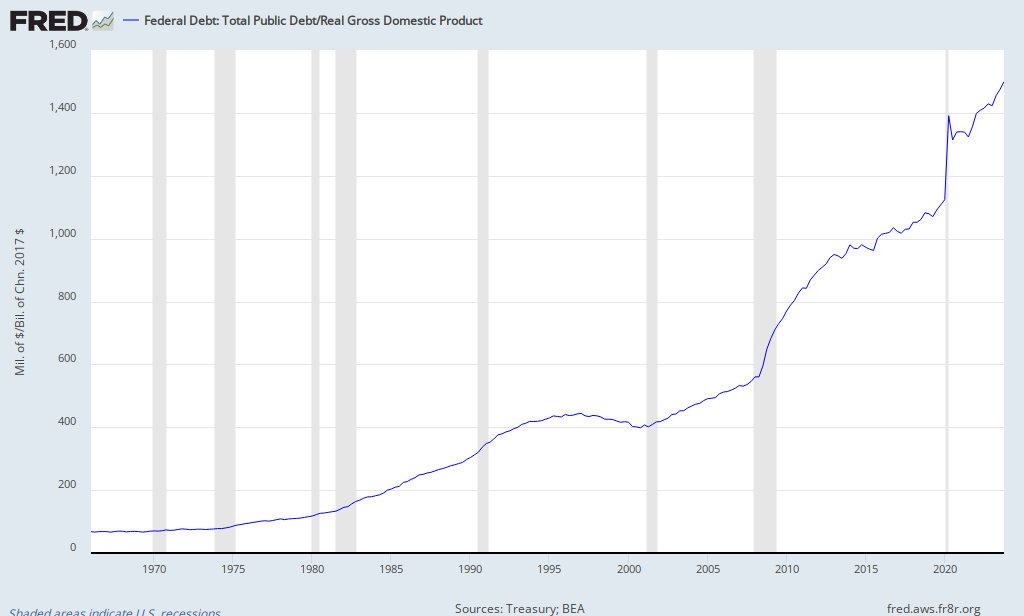
data serie since 1966, in % of GDP, chained 2005 dollar; updated quarterly
Update 10/05 : I add below an extract from the dedicated page about US Debt.
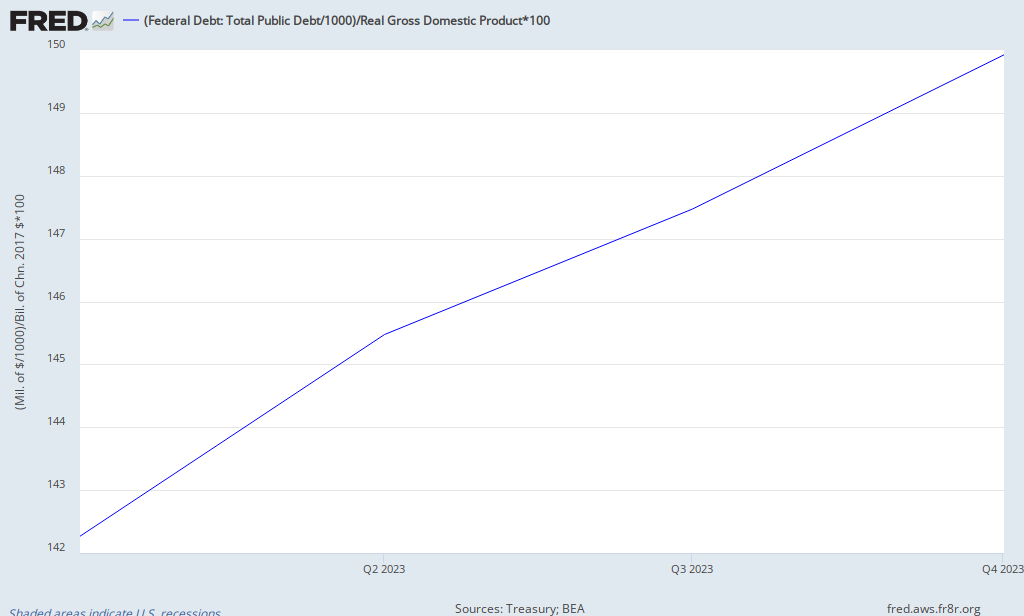
1Year data serie, in % of GDP, chained 2005 dollar; updated quarterly
You read it correctly : figure for 2012Q3 is nearly 118 % (and growing) !!
You can find much more details about US Debt in this dedicated page.
RépondreSupprimerThis page is linked by this review of US Public Debt.
RépondreSupprimerThis page is referenced in this 12 pages study: ¿Caerá en crisis el imperio del dólar?, ... las cifras by Mario Briones R.
RépondreSupprimerThe introduction of this study on 'Movimiento Generación 80' website is here.
RépondreSupprimer