You can click on each chart for a better rendering and zooming.
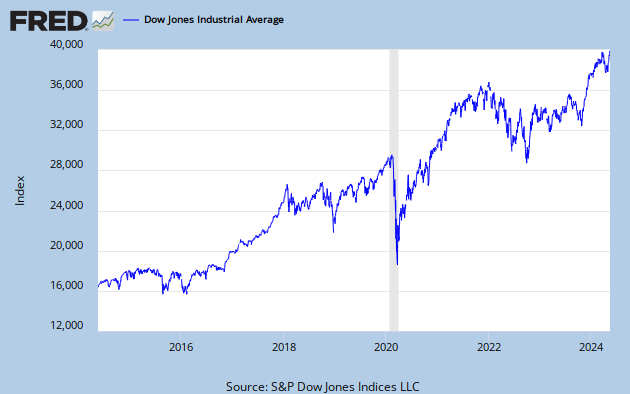
3/25/2014 St Louis FED announced to remove one month later all FRED existing and archived series relative to Dow Jones, S&P500, Case-Shiller indexes. On 4/25/2014, a new announcement explained the series will be kept available but will include only 10 years of moving daily history.
3/25/2014 St Louis FED announced to remove one month later all FRED existing and archived series relative to Dow Jones, S&P500, Case-Shiller indexes. On 4/25/2014, a new announcement explained the series will be kept available but will include only 10 years of moving daily history.
..: Updated Daily :..
Shortcuts to: New Austrian Economics - Gold Basis - Permanent gold backwardation - GOFO - Gold in Asian Markets - BRICS and gold - Gold in Western Markets - Historical price of gold - Gold ETF - Futures and paper gold market - Gold Money Index - If you read this page you're probably looking for this
__________________________
The Role of Gold in the Global Systemic Crisis
Key Indicators and Charts for the Gold Markets & New Austrian Economics
(思想 !)
(思想 !)

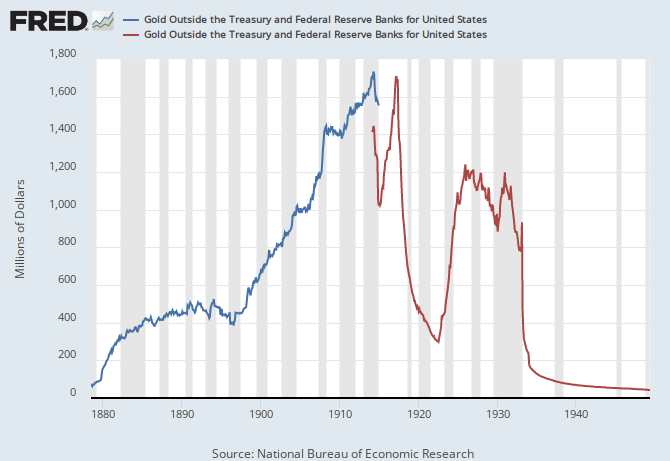
* Destruction of paper money since creation of the Fed :
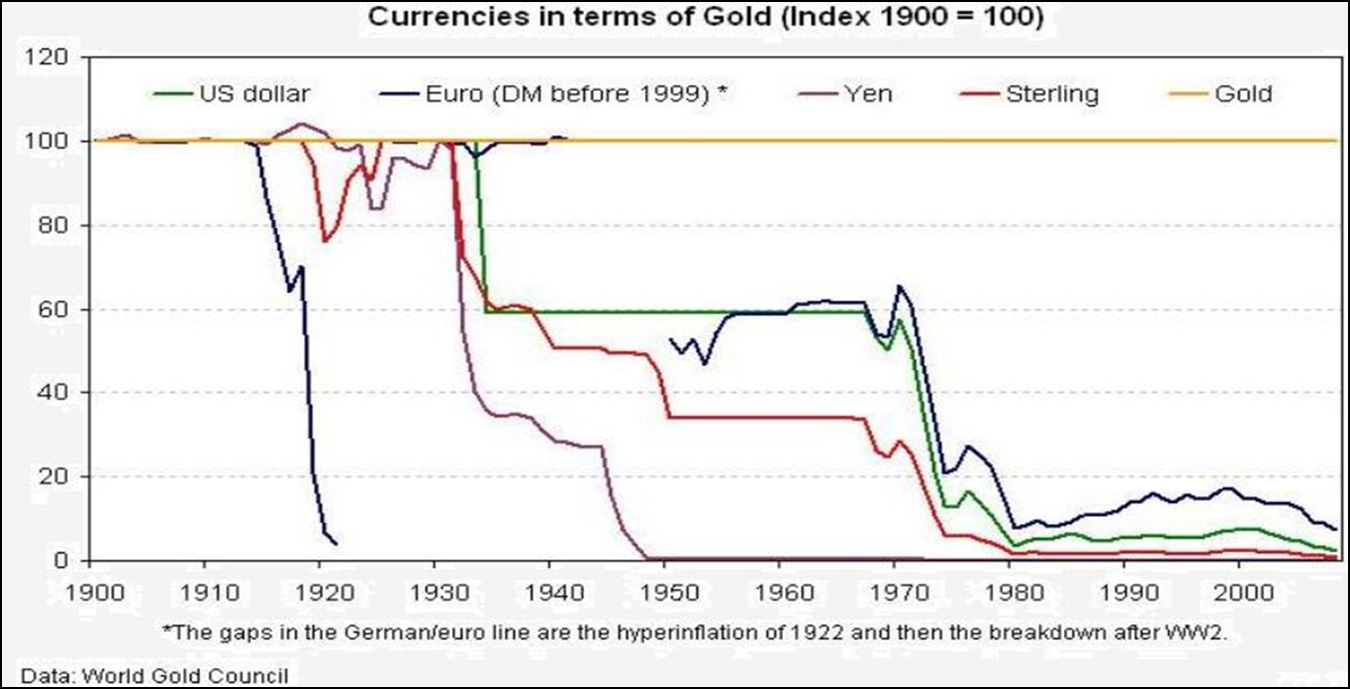
(source)
* US GDP priced in gold :
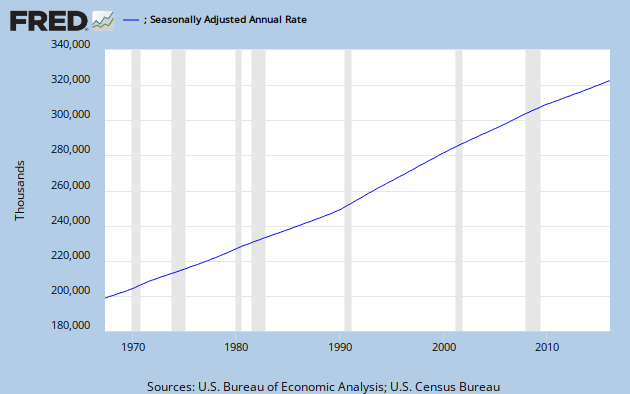
US output produced (GDP, Annual Rate) priced in troy ounces of gold; data serie since 1968; updated quarterly; using LBMA 3pm fixing price

Annual U.S. output produced (GDP) priced in troy ounces of gold;
Source: Conscience-Sociale.org; data series 1791-2012 from Samuel H. Williamson, MeasuringWorth, August 2013.

Source: Conscience-Sociale.org;
Same data series for U.S. till 1970 with exponential regression.

US GDP per capita (Annual Rate) priced in troy ounces of gold; data serie since 1968; updated quarterly; using LBMA 3pm fixing price

Annual U.S. GDP per capita priced in troy ounces of gold;
Source: Conscience-Sociale.org; data series 1791-2012 from Samuel H. Williamson, MeasuringWorth, August 2013.
* UK GDP priced in gold :

Annual UK output produced (GDP) priced in troy ounces of gold;
Source: Conscience-Sociale.org; data series 1830-2011 from Samuel H. Williamson, MeasuringWorth, August 2013.

Source: Conscience-Sociale.org;
Same data series for UK till 1971 with exponential regression.
* The first long term economical development comparison between countries using New Austrian Economics:

Annual U.S. and UK GDP per capita priced in troy ounces of gold;
Source: Conscience-Sociale.org; data series 1830-2012 from Samuel H. Williamson, MeasuringWorth, August 2013.
* US dollar and UST priced in gold :

since 04/1968

U.S. $ priced in mg of Gold;
5Y moving data serie; updated daily; using LBMA 3pm fixing price
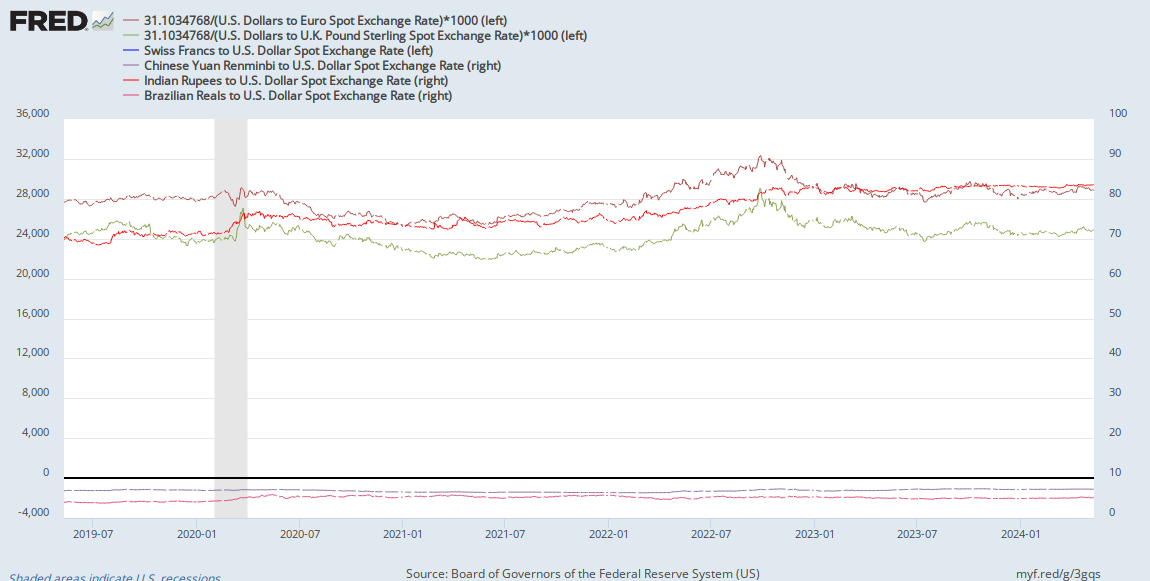
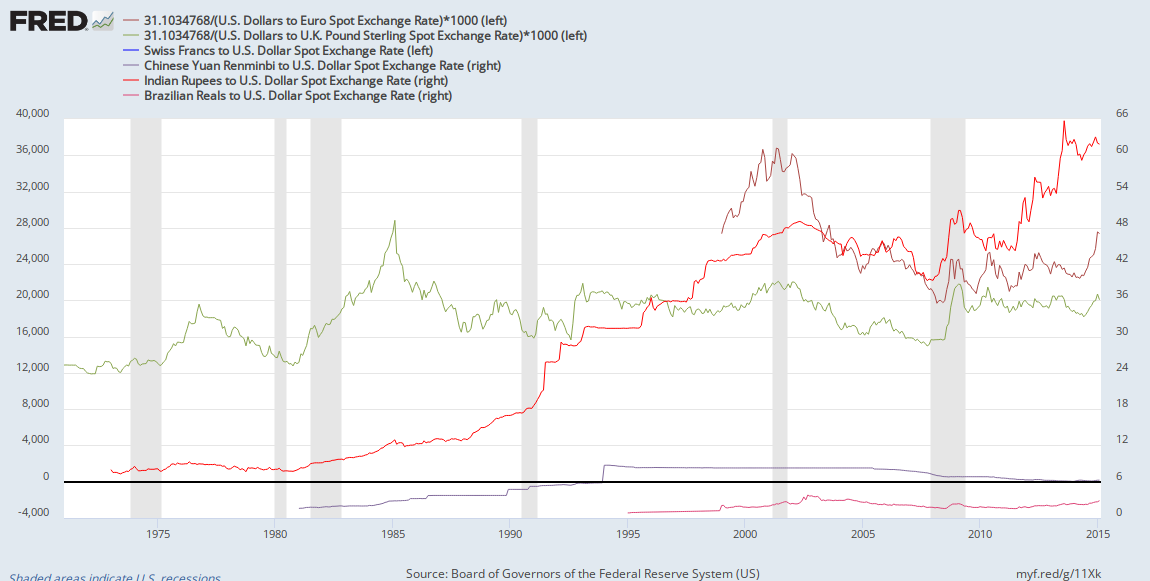
lhs: USD, Euro, GBP, CHF, rhs: Yuan, Rupee, Real priced in mg of Gold ; data series since 01/16/2010; daily data;
using LBMA 3pm fixing prices in USD, euro, GBP
idem, since 1968; updated daily
.png)
Does price of gold evolve together with "dollar strenght" on FX market ?
U.S. $ priced in mg of Gold; U.S. $ priced in deutschmark then in euro ;
data serie since 1971; updated daily; using LBMA 3pm fixing price
.png)
30-Y, 10-Y US Treasury price indexes priced in troy ounces of Gold; data series since 1968; updated daily; using LBMA 3pm fixing price; UST rates index : 1981-07-01 = 100
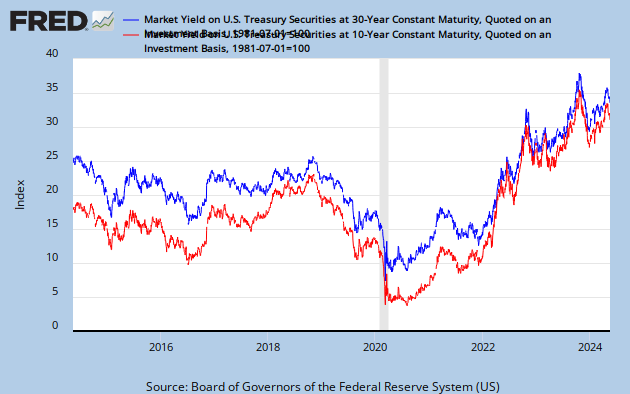
idem, 10 years moving data series
.png)
Trade weighted U.S. Dollar index (major currencies) to Gold ratio; (03/1973 = 100); updated daily, using LBMA 3pm fixing price
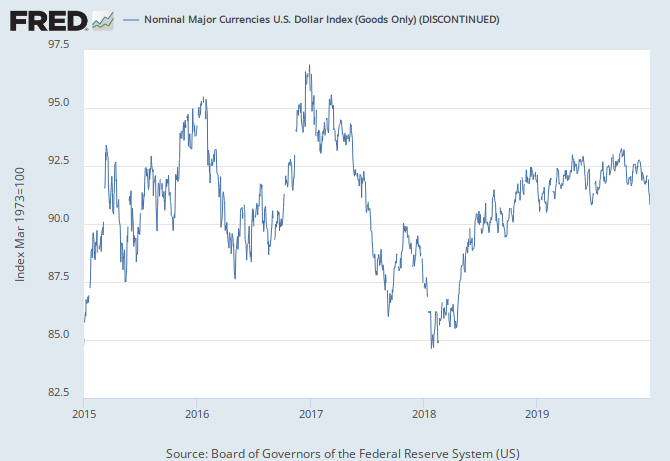
idem; 5 years moving data series
.png)
Real trade weighted U.S. Dollar index (broad) to Gold ratio; (03/1973 = 100); updated daily, using LBMA 3pm fixing price
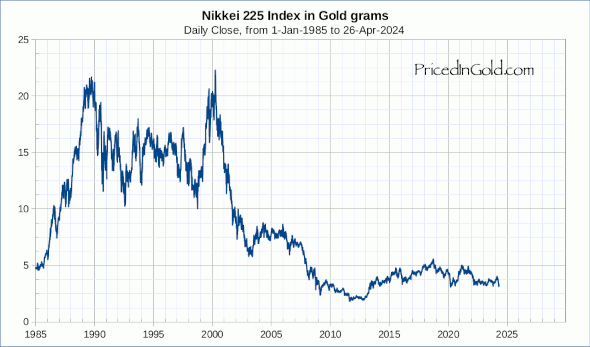
* Stocks markets indices priced in gold :
.png)
S&P500, Dow Jones, Wilshire5000 indexes to Gold ratio; daily data from 1968 to 4/23/2014; using LBMA 3pm fixing price
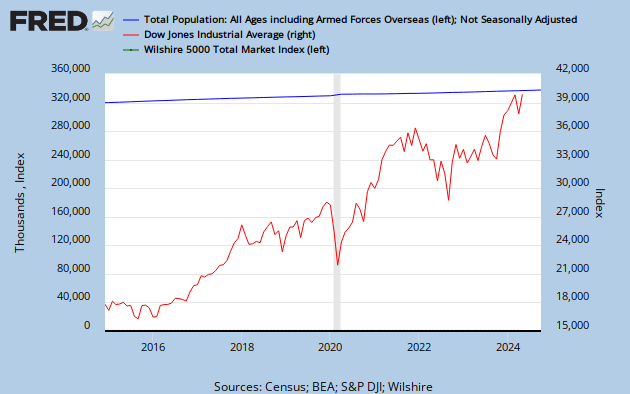
idem, 10Y moving; data series since 1968
.png)
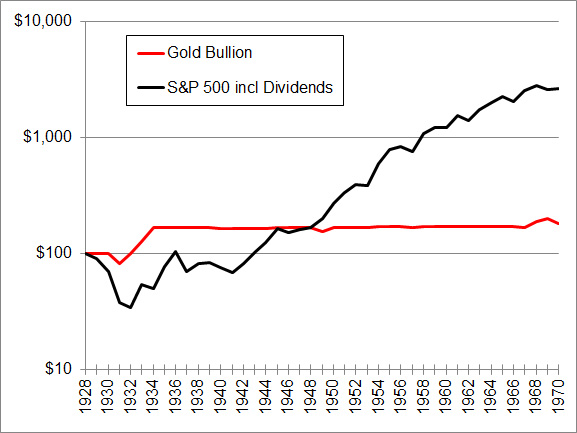
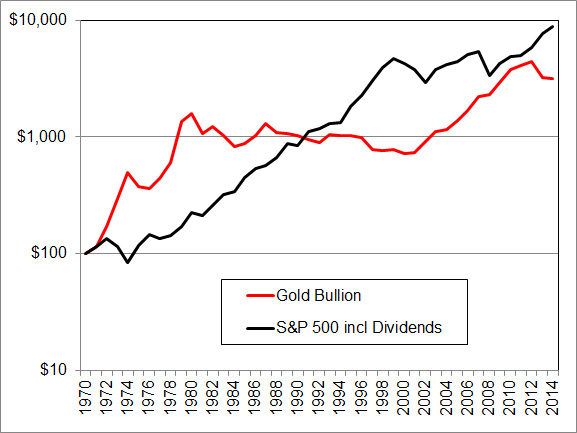
S&P500, and Gold price scaled indexes (100 = 1970-01-01); data series between 1968 and 3/15/2014; using LBMA 3pm fixing price

S&P500 index priced in troy ounces of Gold; data series since 1871, using annual values from Lawrence H. Officer, MeasuringWorth, 2013


.gif)
idem; data serie 1900-2004 ; source
.gif)
idem; data serie 1885-1998; log scale; source


source: Approximity
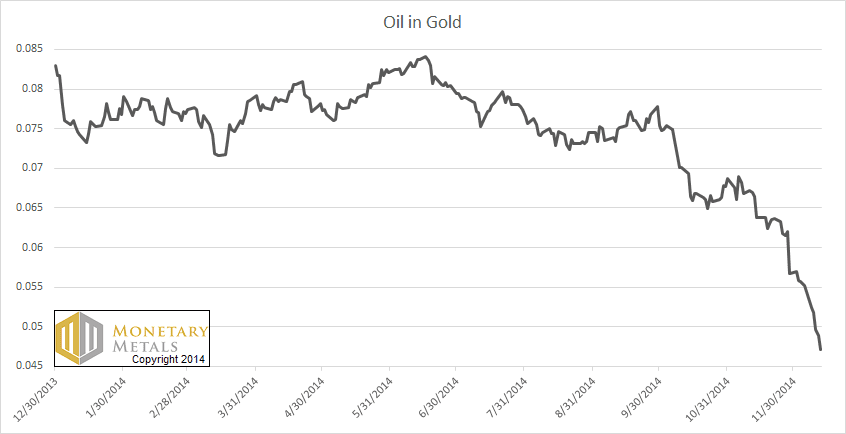
* gold / oil ratio :

long term oil priced in USD ; source
- see also gold / commodities ratios
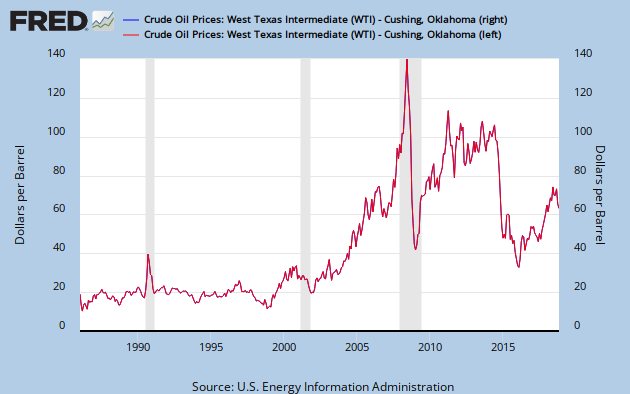
Oil barrel (WTI index) priced in troy ounces of Gold (tr oz/barrel, lhs) and number of barrel per tr oz (rhs); data series since 1986; updated daily; using LBMA 3pm fixing price
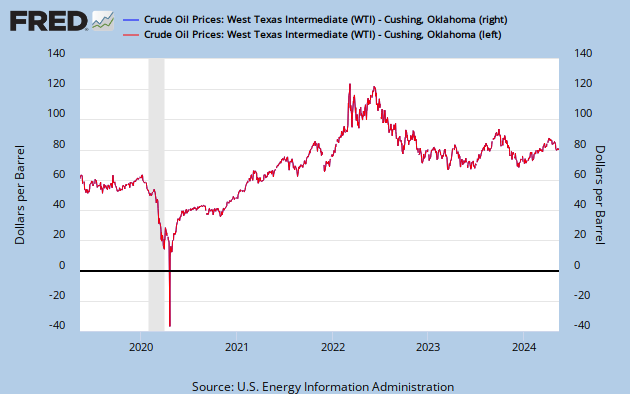
idem, 5Y moving


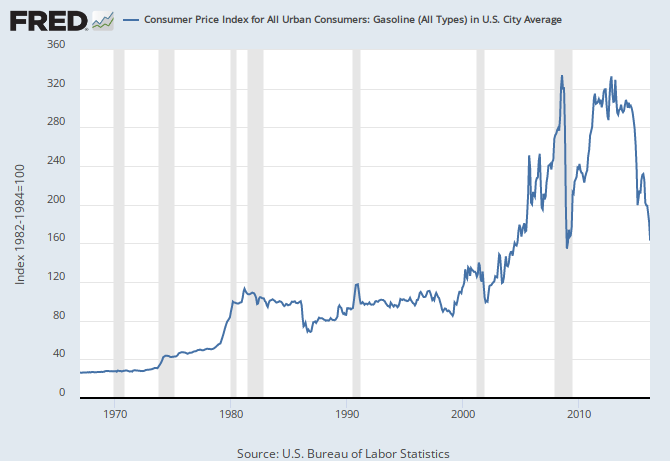
Gasoline index priced in troy ounces of Gold; data serie since 1968; updated monthly; using LBMA 3pm fixing price (eop)
* Commodities priced in gold :

US housing: mean and median prices, priced in troy ounces of Gold; data serie since 1968; updated monthly; using LBMA 3pm fixing price (eop)
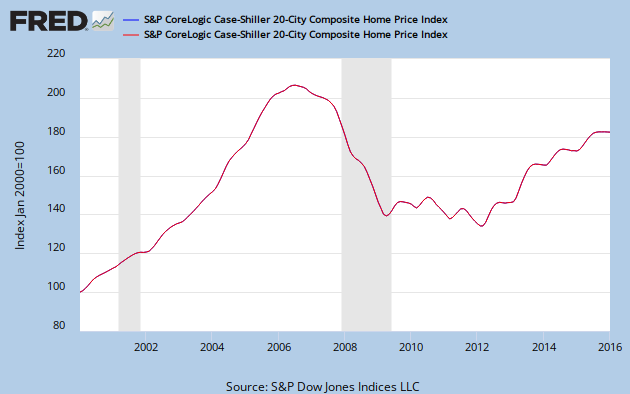
S&P Case-Shiller US 10- and 20-City Home Price indexes, priced in Gold; data series since 1987, NSA; updated monthly; using LBMA 3pm fixing price (eop)
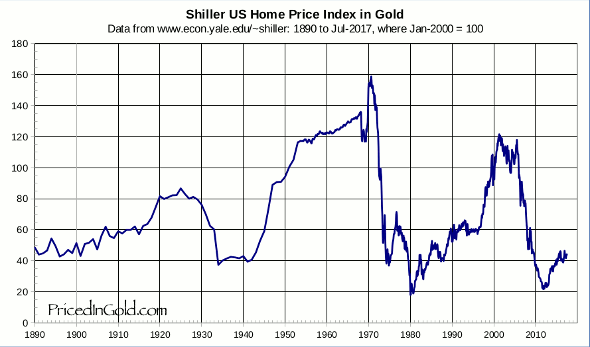
Shiller US Home Price index, priced in Gold; data serie since 1860; updated quarterly
.png)

source: Approximity

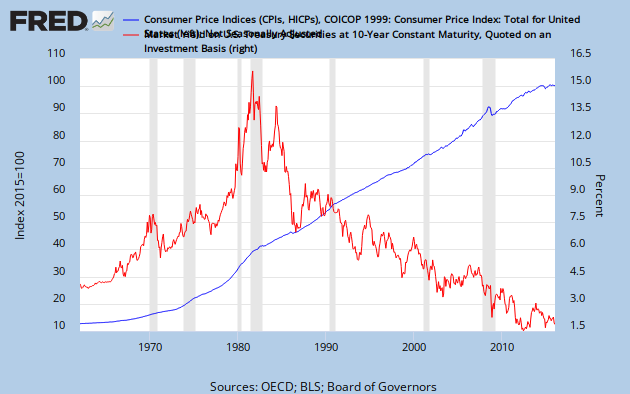
CPI index CPIAUCNS / troy ounce of Gold (lhs, CPI year 2005=100); 10Y UST (rhs); data series since 1968; updated daily; using LBMA 3pm fixing price
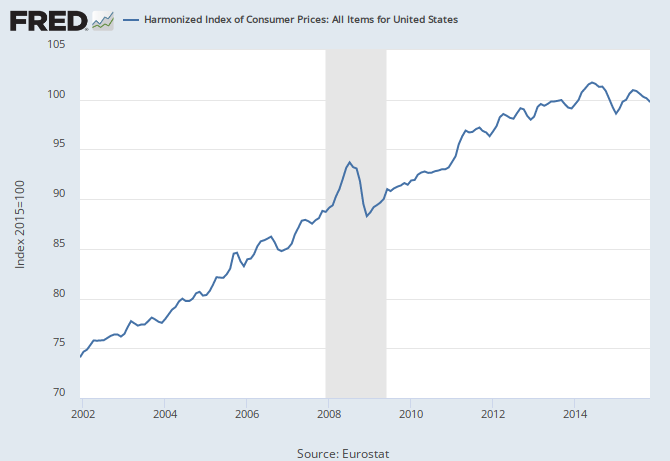
HICP for US priced in gold; data series since 1997
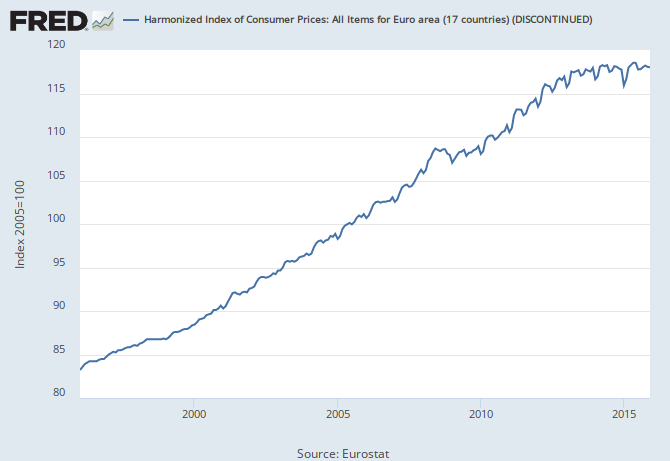
HICP for Eurozone priced in gold; data series since 1999
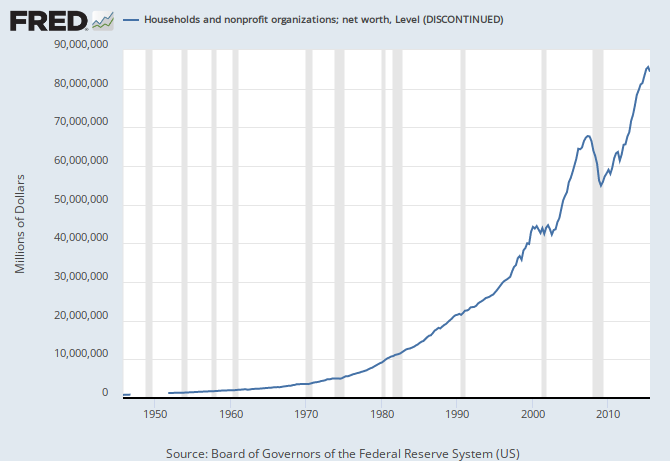
Households and nonprofit organizations: net worth priced in gold ; data series since 1968

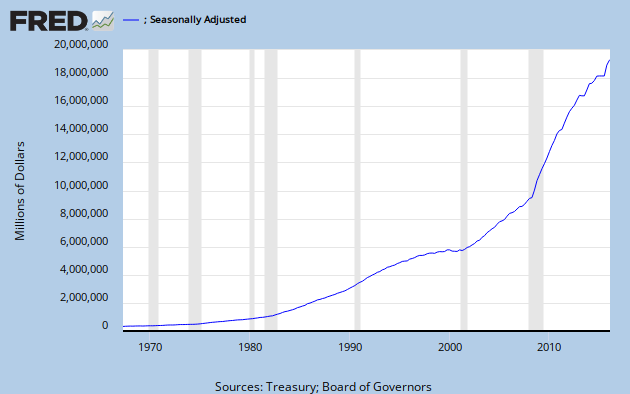
US total public debt priced in tonnes of Gold;
* Monetary aggregates priced in gold :

gold to monetary base ratio since 1915, monthly data; source
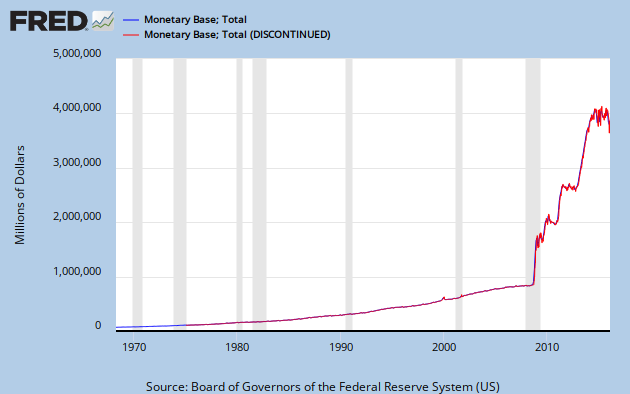
US total monetary base priced in tonnes of Gold;
data series since 1968; updated weekly; using LBMA 3pm fixing price (end of period)
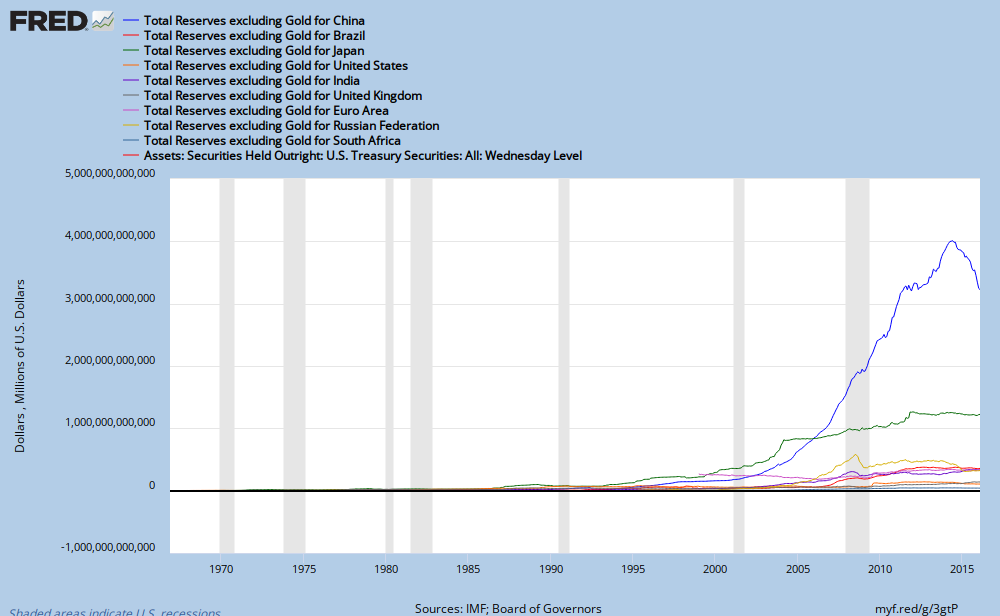
Total Central Bank Reserves excluding Gold for China, Japan, India, US, UK, Russia, South Africa, Euro Zone, Brazil priced in troy ounces of Gold; data series since 1968; updated monthly; using LBMA 3pm fixing price (eop)
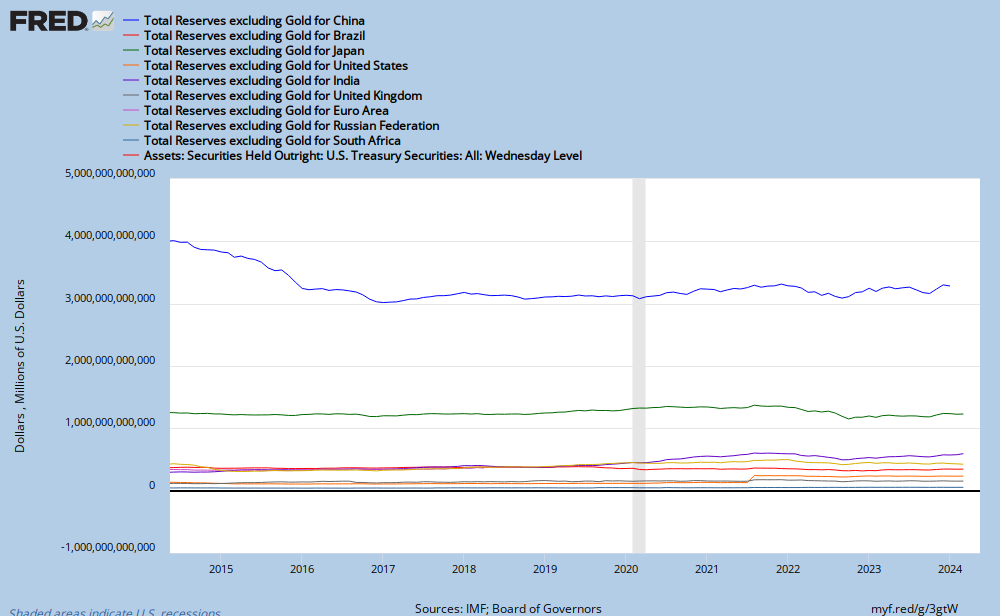
idem, 10Y moving;
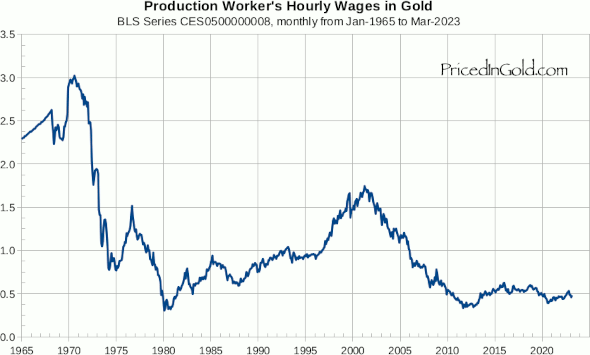
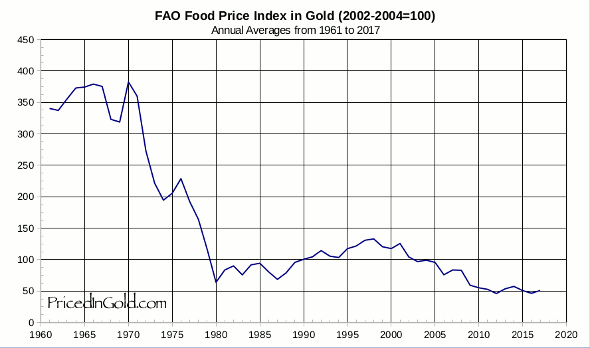
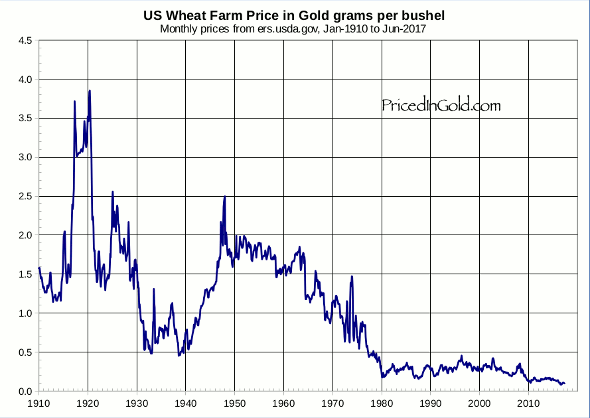
* Many others interesting charts of commodities and securities priced in gold are available on pricedingold.com; for instance :

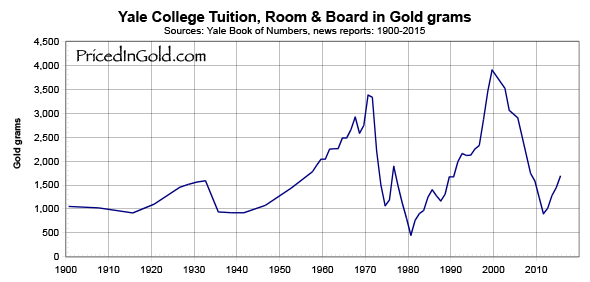

source: Approximity


Soy priced in gold, 1959 - Q2 2012; source
* International currencies priced in mg of gold
- definitions of gold derivatives (full pdf)
- the dangers of gold derivatives (R.H. Howe)
The “Basis” refers to the spread between prices in two different markets or locations for the same underlying commodity or security. These two markets may be separated by physical distance, which is how basis is measured in the grains, or by manner of ownership, which is one of the ways that basis can be measured for gold and silver. In particular, the classic measure of the basis in gold and silver involves analyzing the spread between the spot price of bullion, which is derived primarily from trading on the London Bullion Market (LBM), and the futures price of bullion, which is derived primarily from trading on the COMEX. (source)
* Definitions of Backwardation, Gold Basis and Cobasis :
- Spot price: The price for cash ("immediate") settlement. The bullion market operates on a two-day settlement (the value date is on the 2nd business day following the trade date).
- Comex ‘spot gold close’ is another reference price calculated as the average of the highest and lowest spot prices achieved during the last two minutes of daily trading at Comex.
- Trade Date: Date on which the price was set.
- Value Date: Date on which payment of money and delivery of metal/currency occurs.
- Bid: The price at which someone will buy, that is, the price you will be paid if you sell precious metal.
- Ask or offer: The price at which someone will sell, that is, the price you will pay if you purchase precious metal.
- There is none single "market price": at any given time, there are a price for the buyers, and another price for the sellers. A buyer who wants to buy (i.e. to pay the recorded ask price) enters a "market order". He can as well record a new bid price. A seller who wants to sell has to record his bid price. He can as well enter another "market order" for a recorded ask price. It is very important to understand in details that only transactions at bid and ask prices exist (see a more detailed definition for them). Any others "prices" (last price, end of day price, market price) are only partial or statistical figures, and not a full perception of the market.
- Bid/Ask live physical gold prices are available here (updated every 5s), or here in several currencies (updated every 1mn), or here top left, or here (or below on to top of these charts). Do not confuse XAU (gold ounce/USD currency pair) ticker with the Philadelphia Gold and Silver Index (often ^XAU or $XAU). If you want to retrieve these historical bid/ask data, you can subscribe to a data feed and manage yourself the data collection. Perth mint are publishing free daily historical data but only with an average of bid and an average of ask spot prices. Take care of the currency you are using and the effect of continuous change rates.
- Some Bid/Ask live gold futures prices are available here, here (or here), here, here, and here for NYSE Liffe 100 oz gold futures. If you want to retrieve these historical bid/ask data, you need to subscribe to a GC feed and manage yourself the data collection. Quandl has a great historical collection of data about gold futures, but unfortunately none with their bid/ask prices so far :(
- CME publishes a free daily historical csv file for COMEX gold futures quotations (link at the bottom of this page); column A/B means Ask/bid.
- EurExchange publishes bid/ask gold futures prices, both in US$ and in € (generate Orderbook file if there are a lot of lines)
- Fixing price: In addition to the two-way bid and offer quotations, LBMA gold fixing prices are available. They are single prices determined twice daily (also called bid prices here), quoted in US $, £ and € (details here). In France the fixing prices are determined once daily by the CPOR Devises company and published by Banque de France. These fixing prices (often called 'prime CPOR') are NOT used to calculate the gold basis. Inevitably these fixings are prone to manipulations by the market makers.

- Gold Basis = Gold Futures(bid) - Spot(ask) = carry the gold. It is the difference between a forward price and a nearby price. It does not depend on cleared prices (settled transaction).
- Gold Cobasis = Gold Spot(bid) - Futures(ask) = decarry the gold
- Gold Backwardation: negative Gold Basis and positive Cobasis
- Gold Contango: positive Gold Basis and negative Cobasis (normal situation)
Basis and cobasis are calculated as the annualized returns for carry and decarry. They can be compared to rates of interest for investments of the same duration. Note that both can be negative: there are times when there is no profit to be made in carrying or in decarrying. This is typically a sign of poor liquidity and hence wide bid-ask spreads. But at most only one of them can be positive. (source)
- The contract roll : Buyers of futures must make a decision by First Notice Day (2 working days before the end of the current month). They can either put up the cash and demand delivery of one gold bar per contract. Or they must sell the contract for the next month, and buy a farther month if they want to keep their gold position. This will increase the open interest positions for the farther month contract.
Keith Weiner (6/10/2013): "The gold basis is the profit one can make by carrying gold, which is buying gold and simultaneously selling a futures. One is long a gold bar and short a gold futures which neatly offsets it.
This return does include the bid-ask spread, but does not include exchange fees, storage and insurance, commissions, etc.
Two things are certain. First, the gold carry trade is much less attractive at 0.2% than it was at 0.6% (given the costs, it may not be profitable at all). Second, as the basis falls, fewer and fewer traders will put on a carry position and, below their marginal rate of profit, none will put on a new carry. They may even take their carry position off, if the market offers a profit to do so (backwardation)."
(10/6/2013): "We are interested in the changing equilibrium created when some market participants are accumulating hoards and others are dishoarding. Of course, what makes it exciting is that speculators can (temporarily) exaggerate or fight against the trend. The speculators are often acting on rumors, technical analysis, or partial data about flows into or out of one corner of the market. That kind of information can’t tell them whether the globe is, on net, hoarding or dishoarding.One could point out that gold does not, on net, go into or out of anything. Yes, that is true. But it can come out of hoards and into carry trades. That is what we study. The gold basis tells us about this dynamic."
(10/6/2013): "We are interested in the changing equilibrium created when some market participants are accumulating hoards and others are dishoarding. Of course, what makes it exciting is that speculators can (temporarily) exaggerate or fight against the trend. The speculators are often acting on rumors, technical analysis, or partial data about flows into or out of one corner of the market. That kind of information can’t tell them whether the globe is, on net, hoarding or dishoarding.One could point out that gold does not, on net, go into or out of anything. Yes, that is true. But it can come out of hoards and into carry trades. That is what we study. The gold basis tells us about this dynamic."
* See here and here the charts of the temporary gold backwardation which occurred from 12/2/2008.
* Gold Basis (in %) between 11/29/2010 and 12/08/2010 :

* Gold went in temporary backwardation since November 2011 :

Dec. 2011, Feb., Apr., Dec. 2012 futures contracts: Gold Bases and Cobases; source

Dec. 2011, Feb., Apr., Dec 2012 futures contracts: Gold Cobases; source
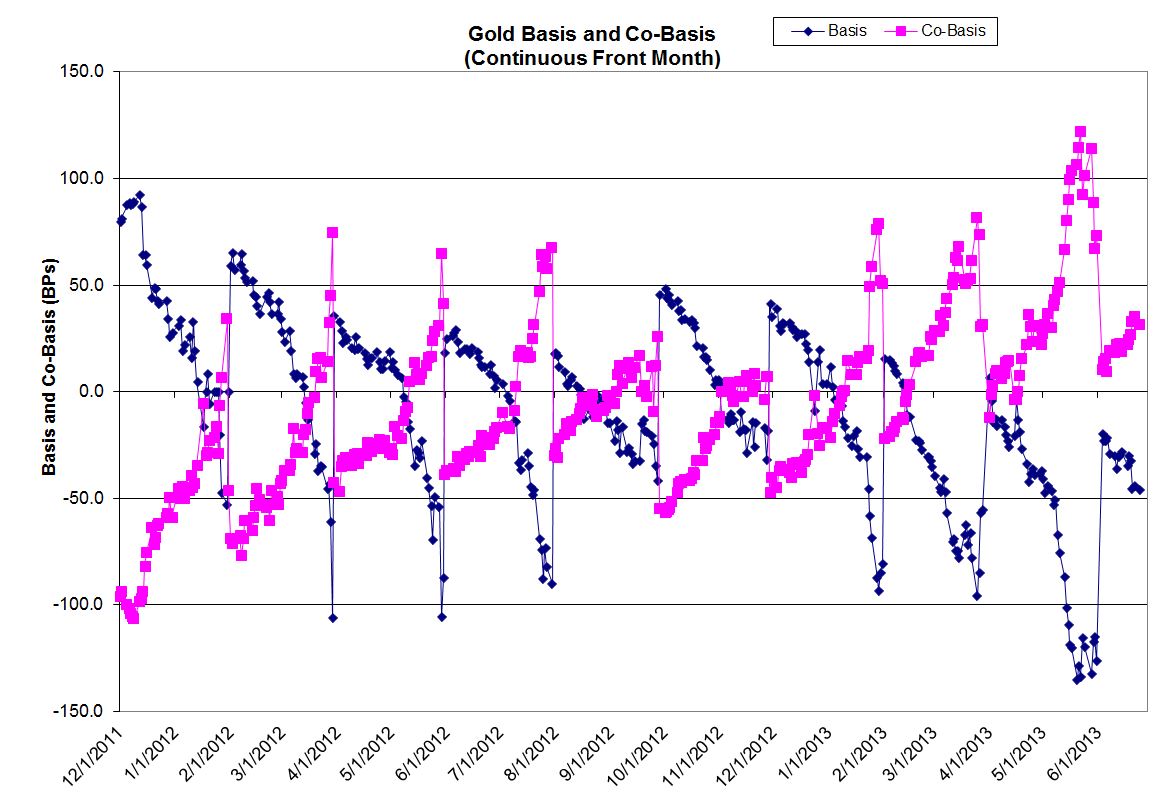
Gold Basis and Cobasis, using continuous front month GC1 contract; data series between 12/2011 and 06/2013; source

March and April 2012 futures contracts: Gold Basis and Cobasis; source

August 2012 futures contract: Gold Basis and Cobasis; source

Dec. 2012, Feb. 2013, Apr. 2013 futures contracts: Gold Bases and Cobases; source

Feb. 2013 futures contract: Gold Basis and Cobasis; source
April 2013 futures contract: Gold Basis and Cobasis; source


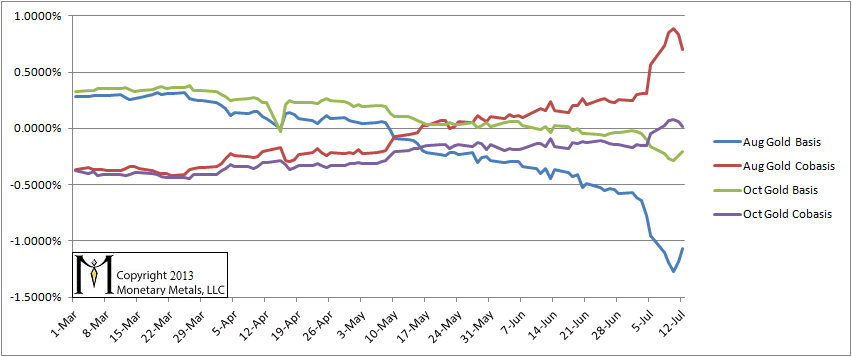
August and October 2013 futures contracts: Gold Bases and Cobases (source)

October 2013 futures contract: Gold Basis and Cobasis (source)

December 2013 futures contract: Gold Basis between 07/2012 and 01/2013 (source)


Dec. 2013 future contract: Gold Basis and Cobasis, between 12/2012 and 06/2013; source
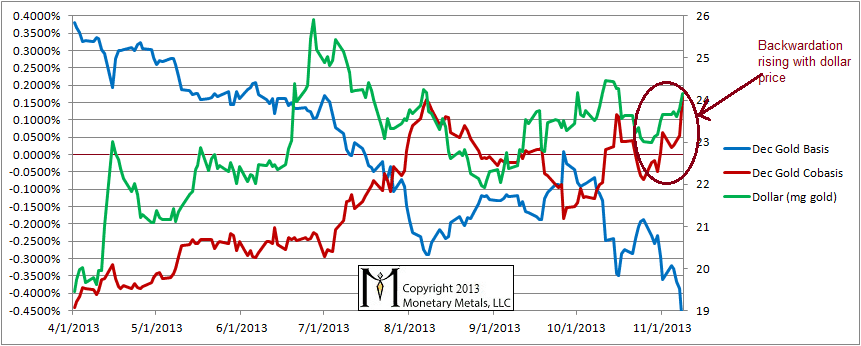
December 2013 futures contract: Gold Basis and Cobasis (source)

Feb. 2014 futures contract: Gold Basis and Cobasis (source)
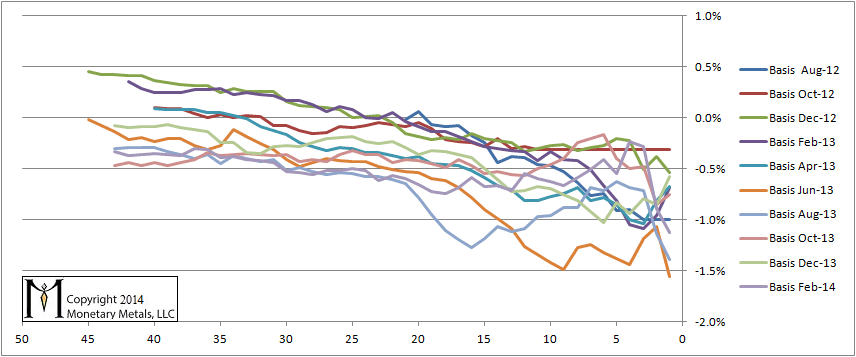
A falling trend: Basis for gold futures contracts in Aug. 2012 through Feb. 2014, as each heads into expiration. The bottom axis is labeled with the number of trading days prior to the first of the month named in the contract (e.g. for the June contract, 1 means May 31). Source

Feb. (plain) and Apr. (dashed) 2014 futures contracts: Gold Bases (in blue) and Cobases (in red) till 12/9/2013 (source)

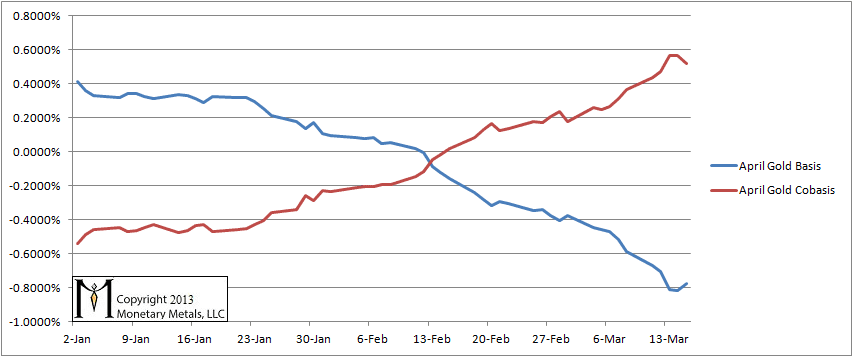
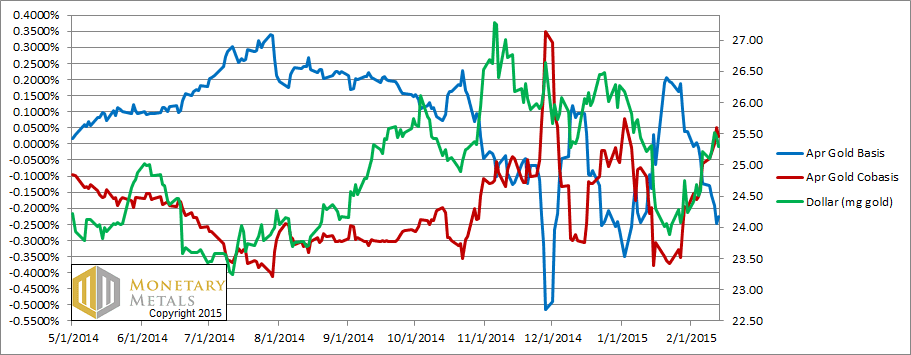
Apr. 2014 futures contract: Gold Basis and Cobasis (source)
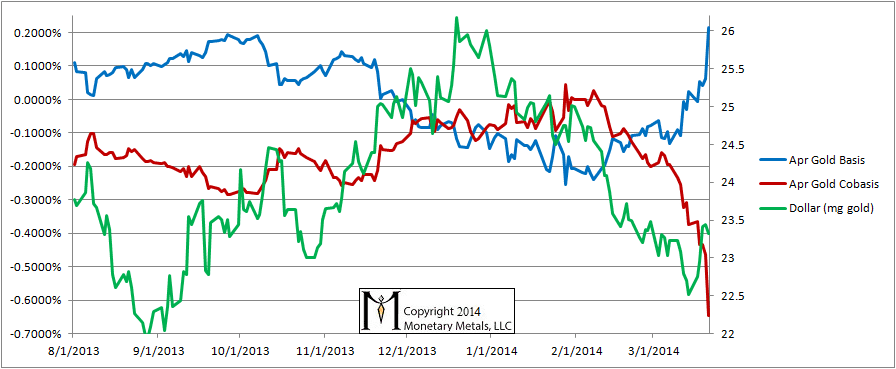
Apr. 2014 futures contract: Gold Basis and Cobasis (source)
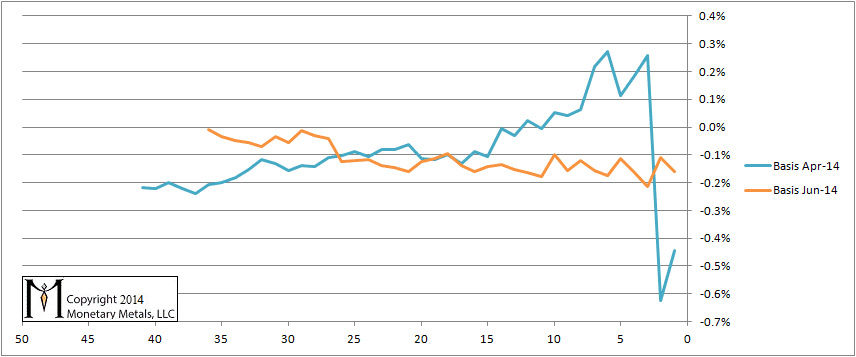
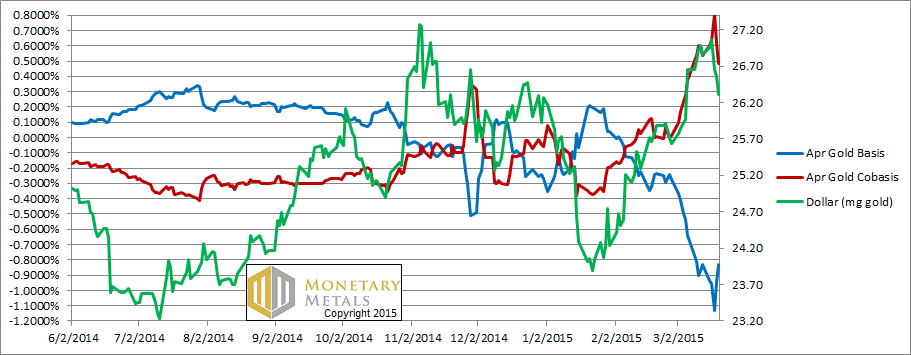
Bases for Apr. and June 2014 gold futures contracts, as each heads into expiration. The bottom axis is labeled with the number of trading days prior to the first of the month named in the contract (e.g. for the June contract, 1 means May 31). Source

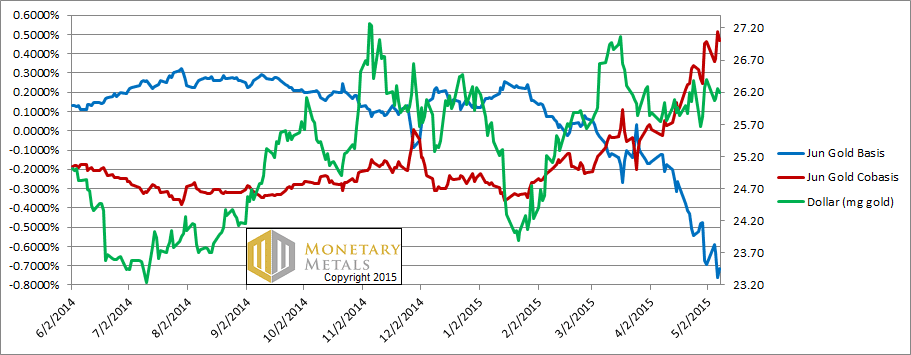
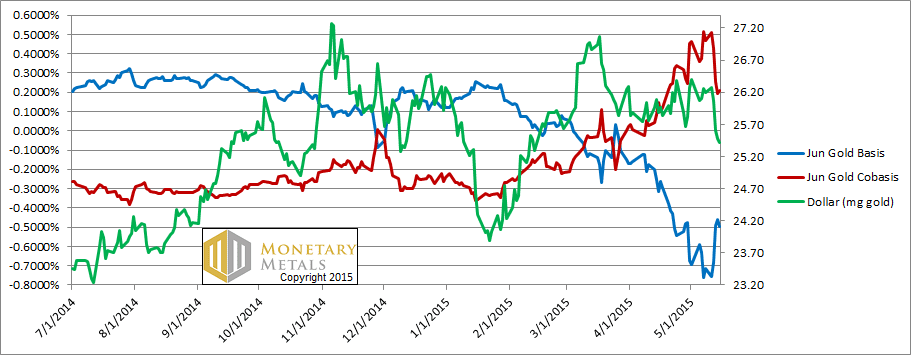
June 2014 futures contract: Gold Basis and Cobasis (source)

June 2014 futures contract: Gold Basis and Cobasis (source)
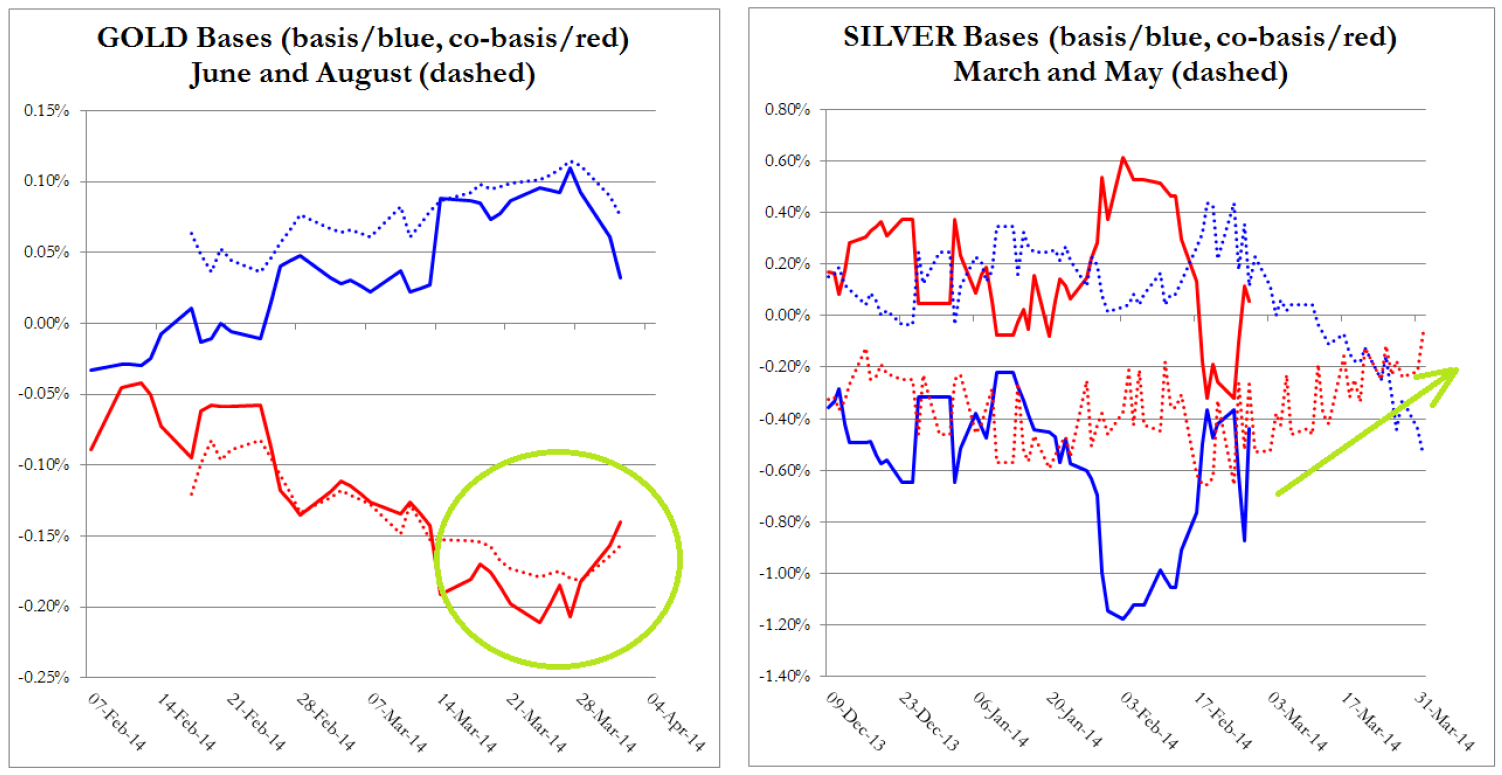
June and Aug. 2014 futures contracts: Gold Bases and Cobases (source)

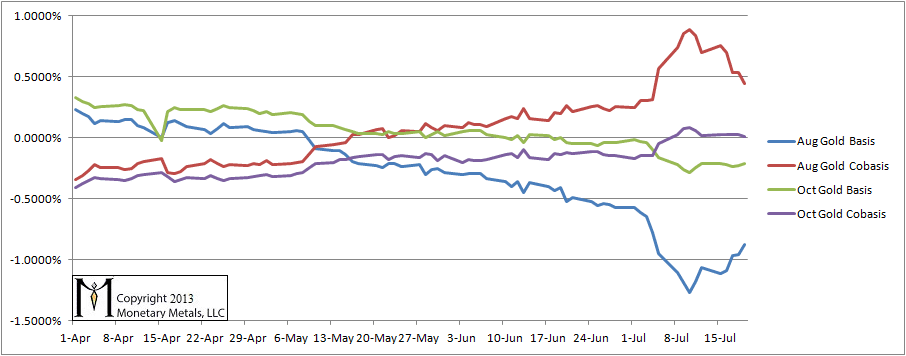
Aug. 2014 futures contract: Gold Basis and Cobasis (source)
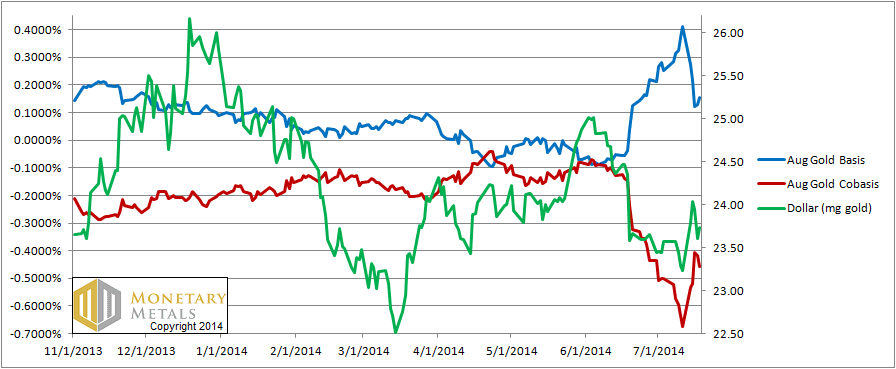
Aug. 2014 futures contract: Gold Basis and Cobasis (source)

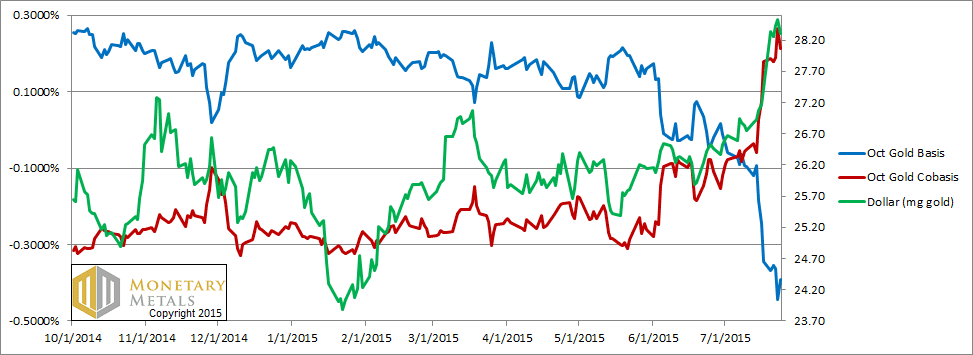
Oct. 2014 futures contract: Gold Basis and Cobasis (source)
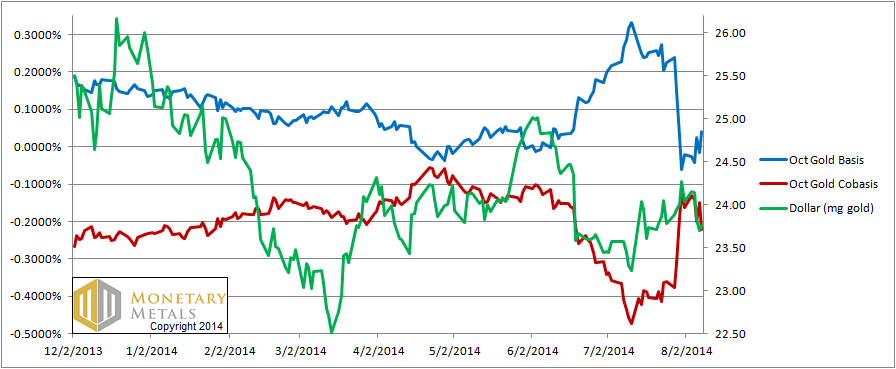
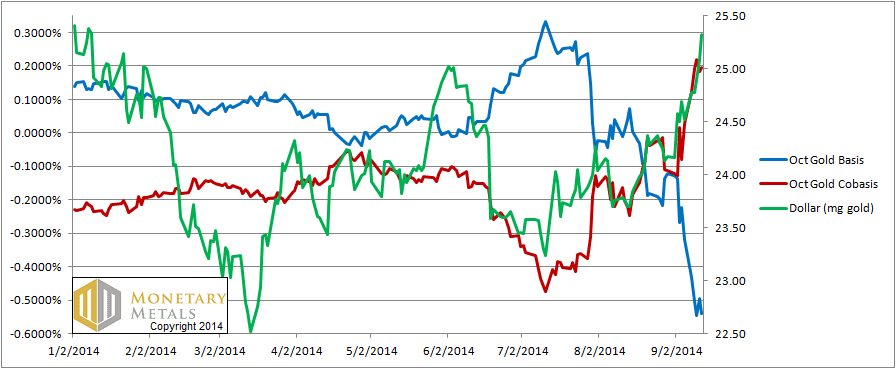
Oct. 2014 futures contract: Gold Basis and Cobasis (source)
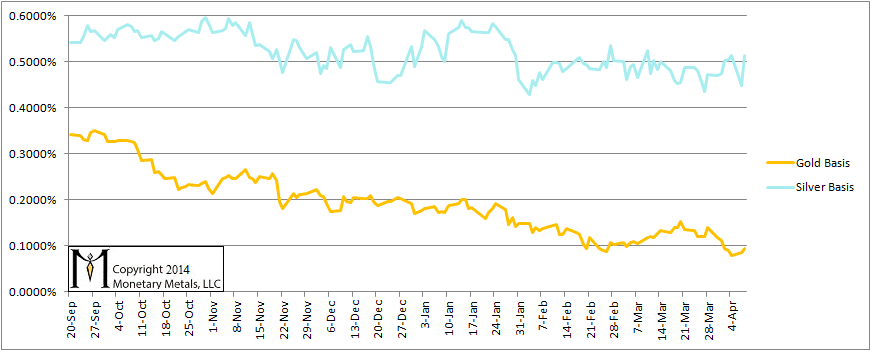
Dec. 2014 futures contracts: Gold and Silver Bases (source)

Dec. 2014 futures contract: Gold Basis and Cobasis (source)
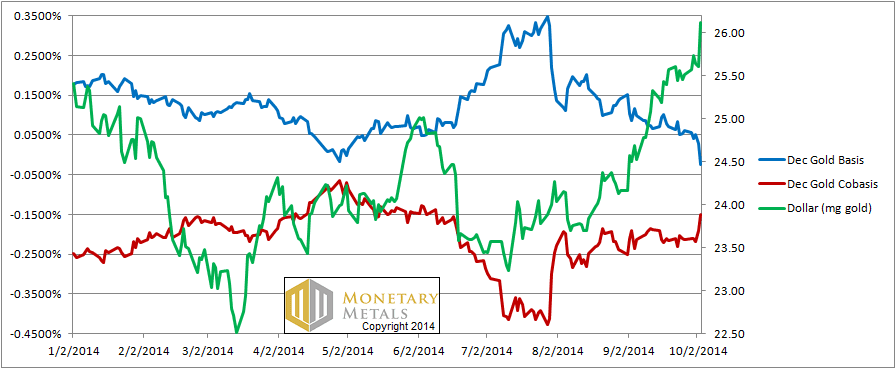
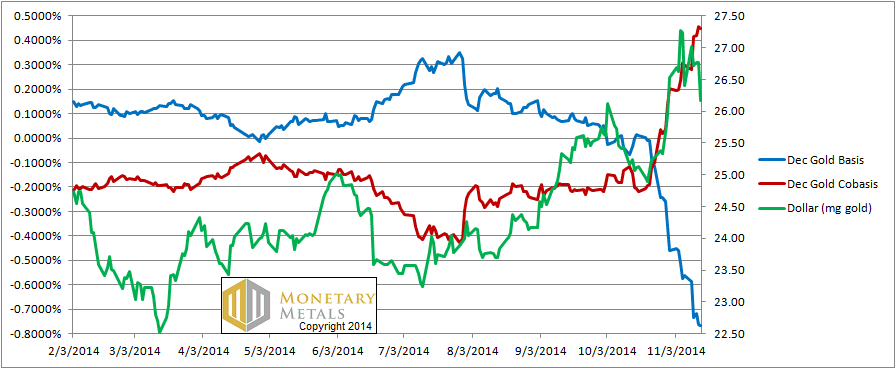
Dec. 2014 futures contract: Gold Basis and Cobasis (source)
K.Weiner: "Incidentally the rising cobasis heading into each contract’s expiry is a compelling piece of data to debunk the manipulation theories. It shows a relentless selling pressure on the contract. If bullion banks were massively naked short, they would not be selling but buying. It is speculators. They are naked long, so they must sell before First Notice Day. This pushes down the bid.
Basis = Future(bid) – Spot(ask). And we do indeed see the collapse of the basis every time.
Cobasis = Spot(bid) – Future(ask). When the bid is pushed down, the market makers pull down the ask. However, as a contract heads into expiry we can expect the market makers to be less aggressive as they need to exit their own positions and close their book before First Notice Day as well.
The bottom line is that the basis collapses and the cobasis rises, but more reluctantly."
Watch also this video interview.
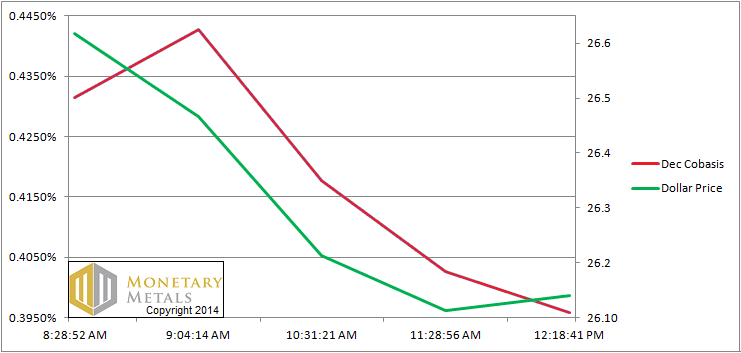
Dec. 2014 futures contract: friday 11/14/2014 intraday Gold Basis; Times are GMT–7 (source)
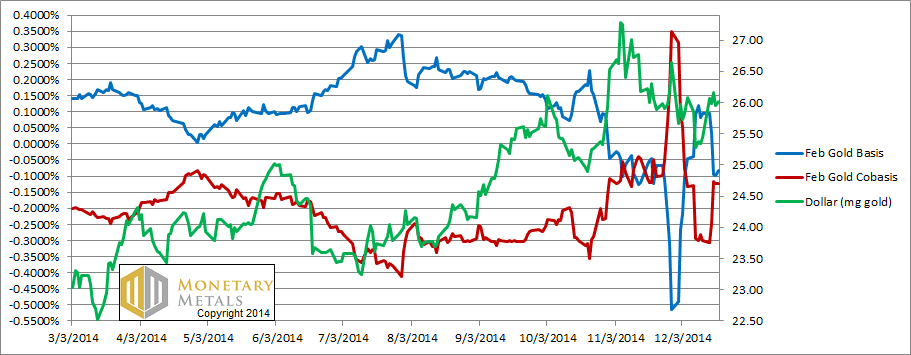
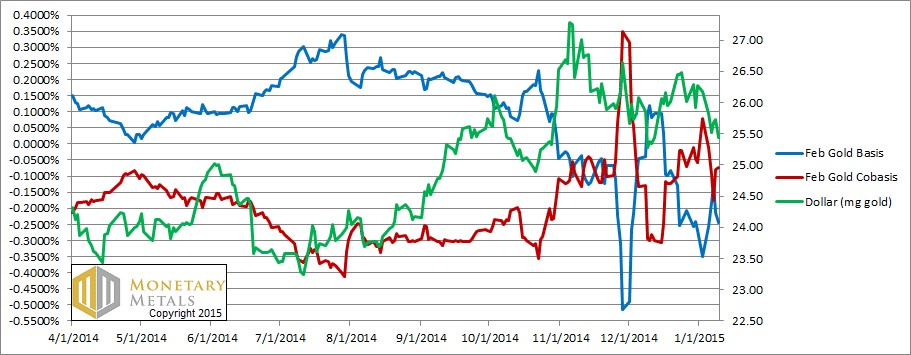
Feb. 2015 futures contract: Gold Basis and Cobasis (source)
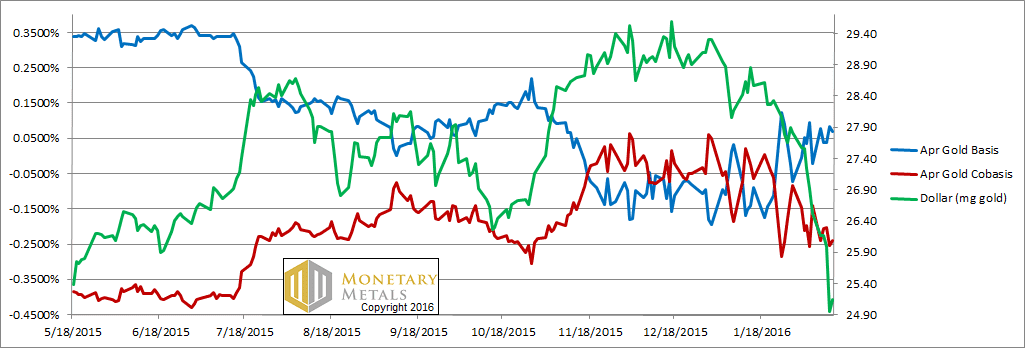
Apr. 2015 futures contract: Gold Basis and Cobasis (source)
June 2015 futures contract: Gold Basis and Cobasis (source)
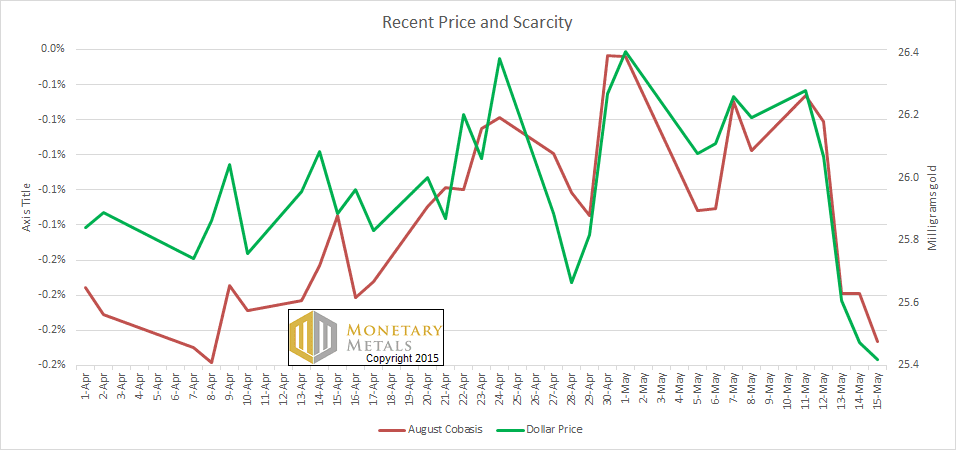
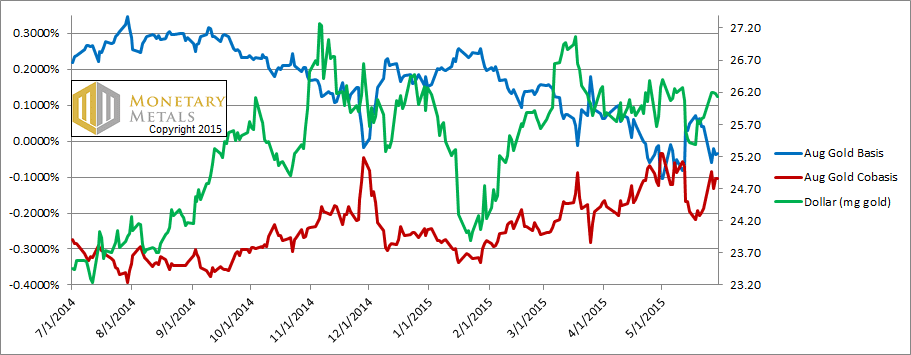
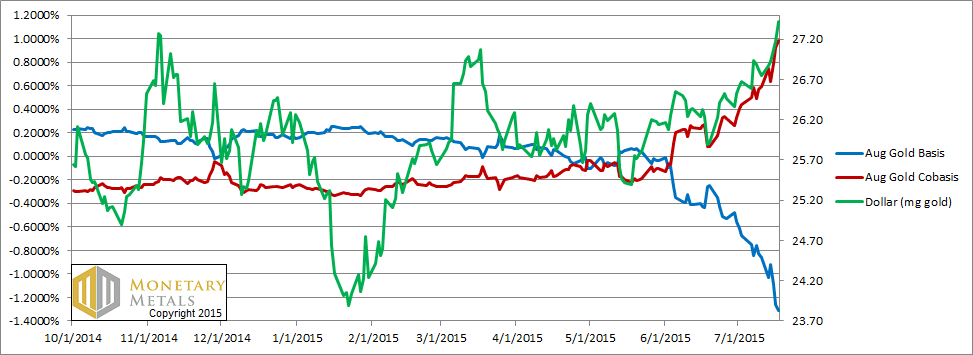
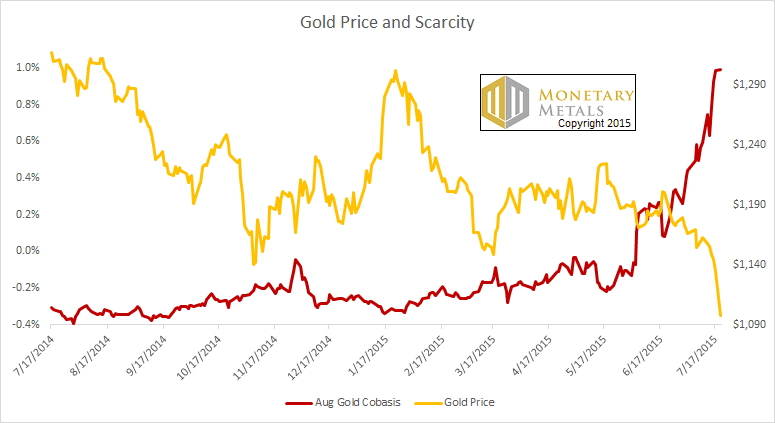
August 2015 futures contract: Gold Basis and Cobasis (source)
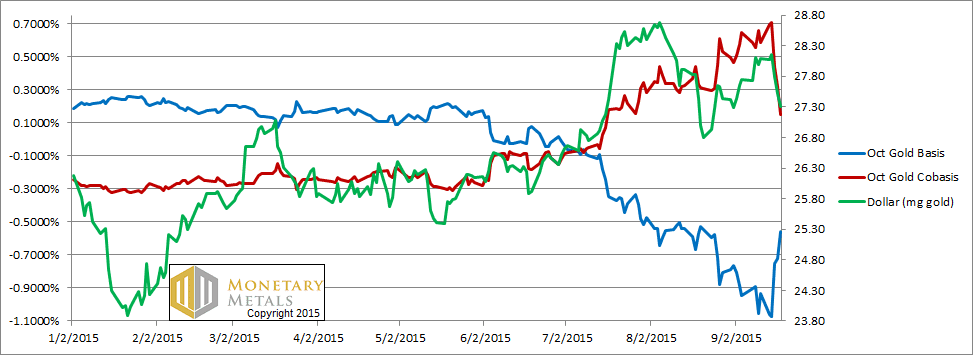
October 2015 futures contract: Gold Basis and Cobasis (source)
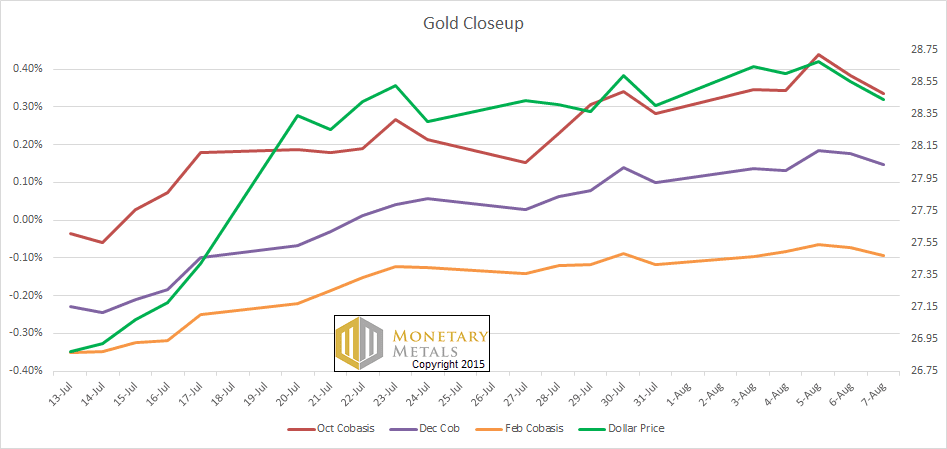
Oct., Dec. 2015, Feb. 2016 futures contracts: Gold Cobases (source)
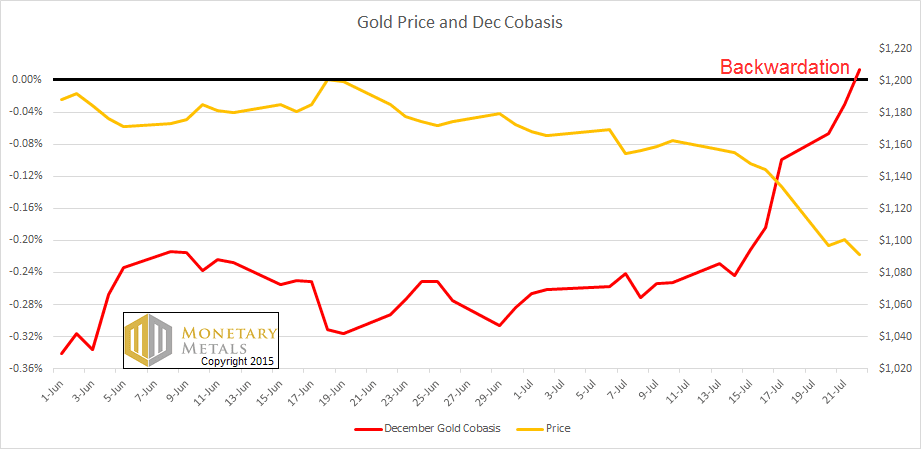
Dec. 2015 futures contract: Gold price and Cobasis (source)
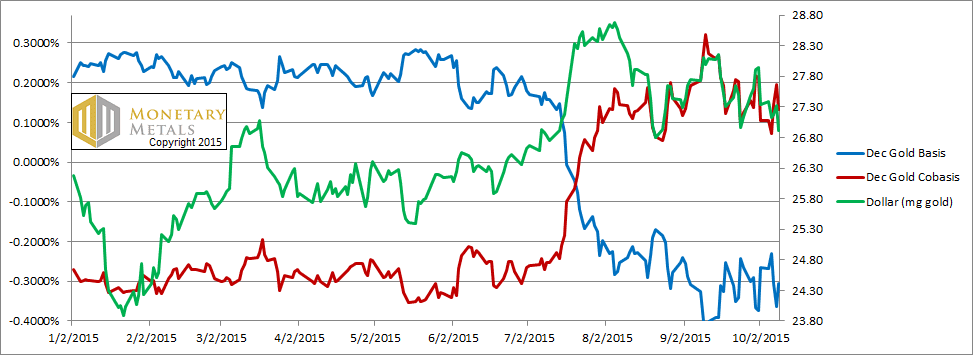
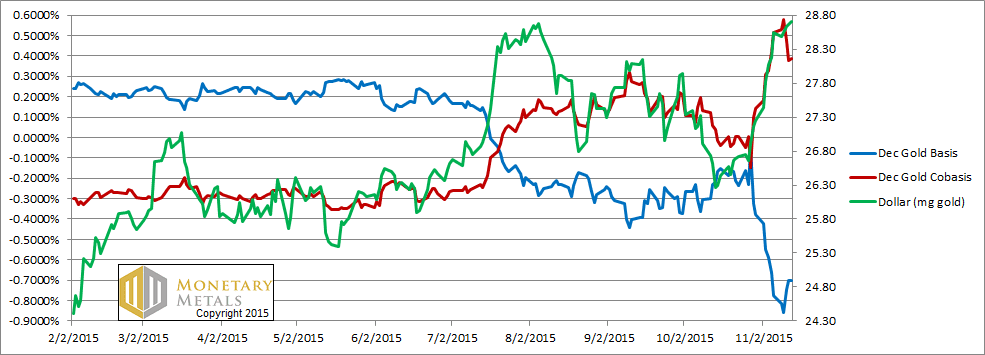
Dec. 2015 futures contract: Gold Basis and Cobasis (source)
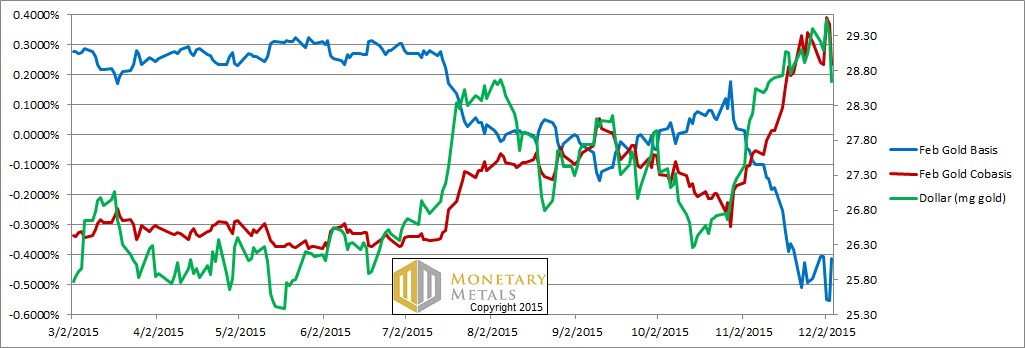
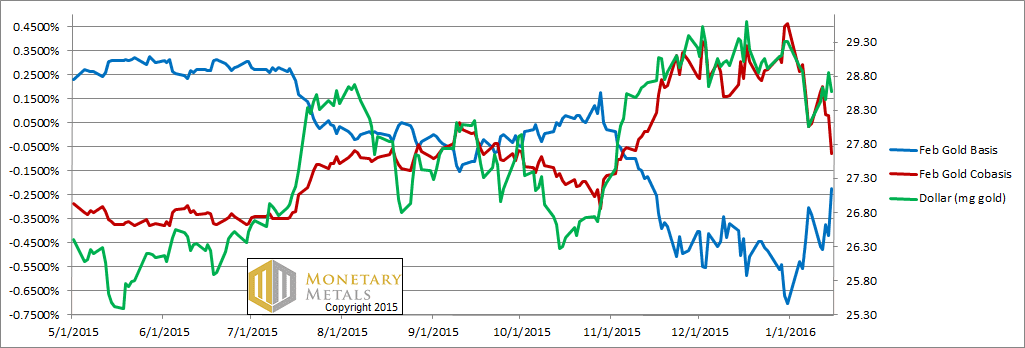
Feb. 2016 futures contract: Gold Basis and Cobasis (source)
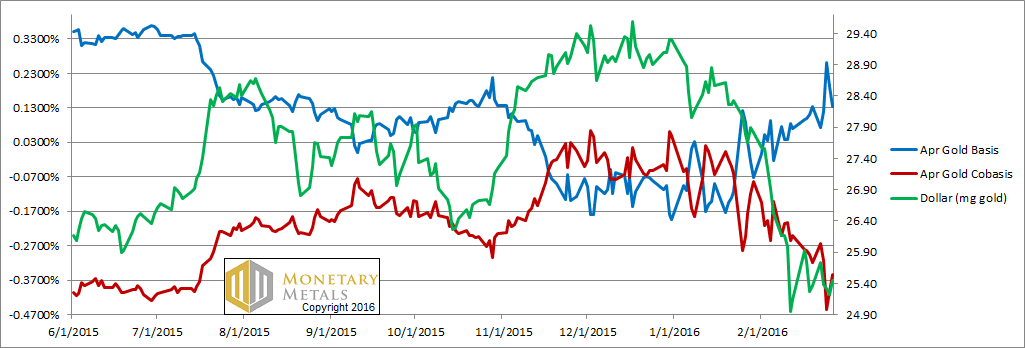
Apr. 2016 futures contract: Gold Basis and Cobasis (source)
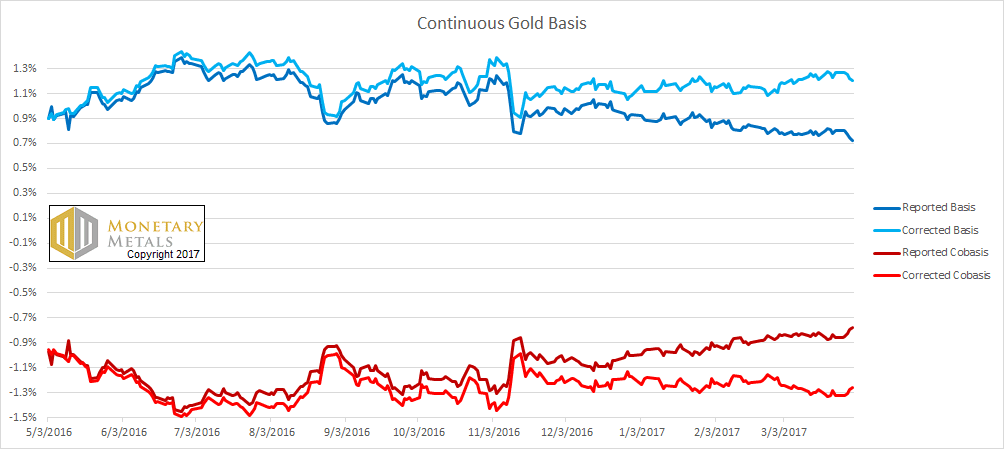
The Reported and Corrected Continuous Gold Basis and Cobasis up to 3/31/17 (source)
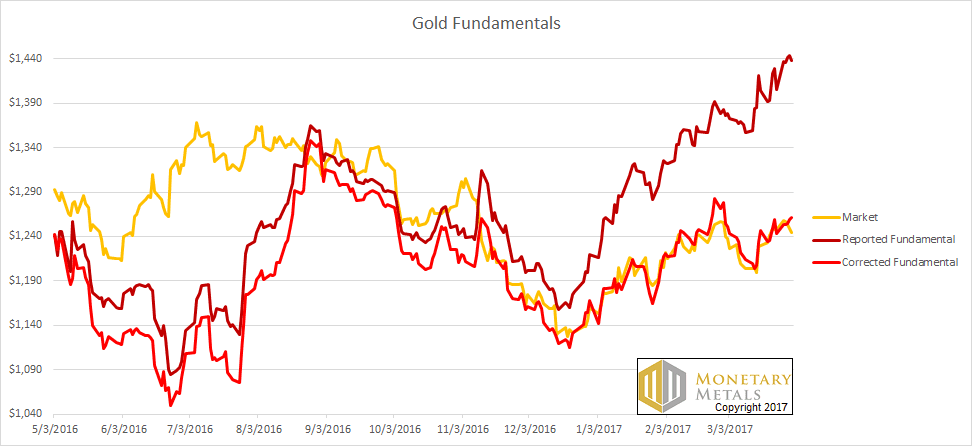
The Reported and Corrected Gold Fundamental Prices (source)
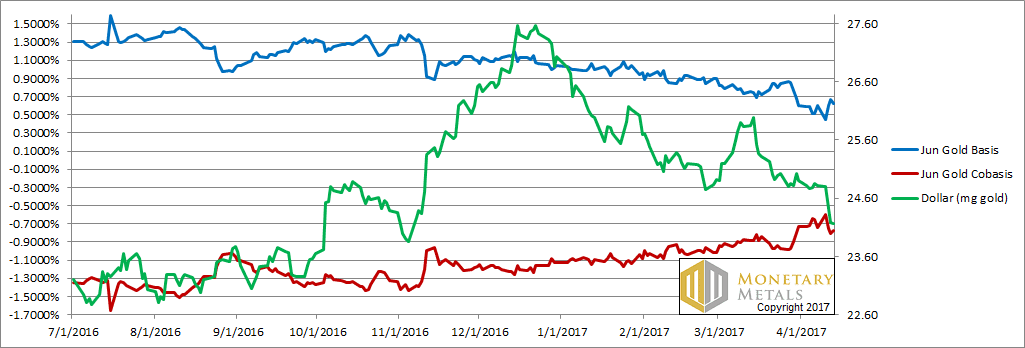
June 2017 futures contract: Gold Basis and Cobasis (source)
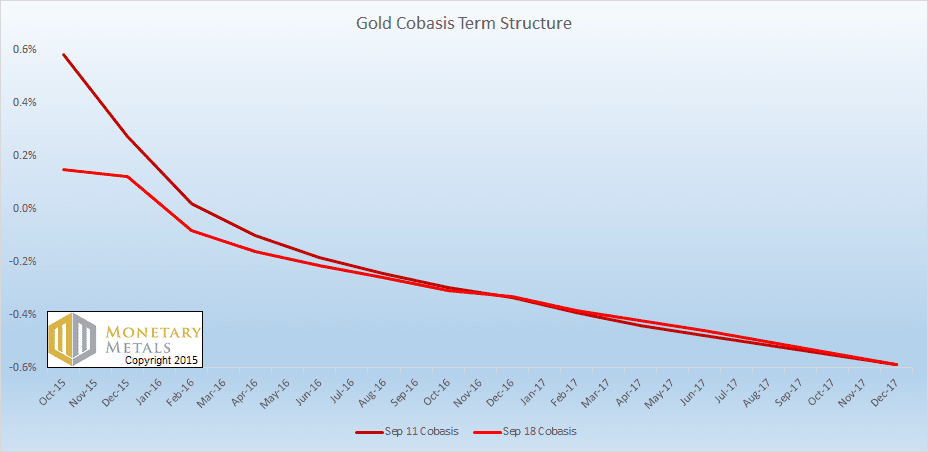
Oct. 2015 to Dec. 2017 futures contracts: Gold Cobasis Term Structures 09/11 and 09/18/2015 (source)
~~~~~~~~~~~~~~~~~~~~~~~
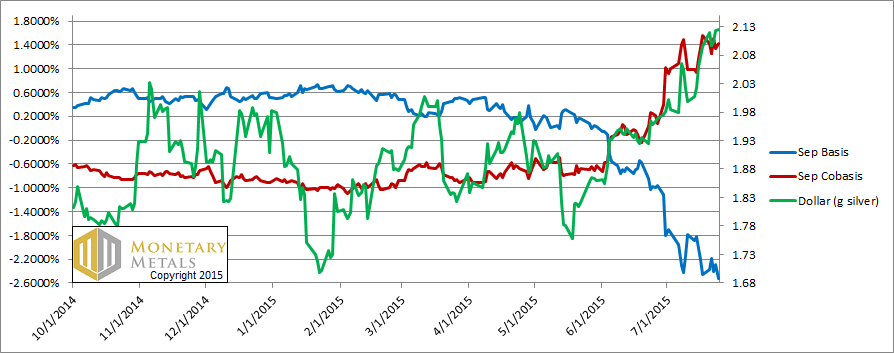
Sept. 2015 futures contract: Silver Basis and Cobasis (source)
K.Weiner: "Silver bases are much more volatile than in gold. And silver has a much stronger basis distortion field than gold.
As a futures contract approaches First Notice Day, those who own it must sell unless they have the cash and desire to take delivery. They’re interested in leverage, to make dollar profits on a rising price, and only a small percentage actually want the metal. So they must sell the expiring contract and buy the next one. This pushes the expiring contract down, which tends to cause backwardation. This is a distortion, not real signal. It’s an artifact of the mechanics of the market. It is caused by having discrete contracts.
In silver, the near contract tends to be pushed down much more than the near one in gold. Also, there is often an effect on the next contract out and that contract is also pushed down in silver more than in gold."
~~~~~~~~
* The duration (number of backwardation days before end of the futures contract) is quickly increasing month after month. This is the path towards permanent gold backwardation. October 2013 futures contract first backwardated July 8, or 61 trading days before October 1.
Keith Weiner (7/21/2013): "One should regard rising backwardation as one would regard rising Credit Default Swaps on a [sovereign] bond. Even if the yield on a bond isn’t rising exponentially (yet), rising CDS should be cause for concern.
The temporary backwardation in Gold and Silver is like a distortion field; as we move closer to each futures contract expiry, that contract is pulled into backwardation. The bid drops, which causes the basis to fall off the bottom of the chart. This could be due to heavy selling, as naked longs must sell before First Notice Day (since they haven’t got the cash to buy the metal). Their selling, of course, presses down the bid.
But the mechanics of the contract roll does not fully explain the phenomenon. For one thing, the distortion field is wider for silver than for gold. The basis for September silver has been falling in earnest since shortly after the April 15 crash. This shows that scarcity is increasing at the lower price.
Think of temporary backwardation as rot in the heart of a tree. It can spread for years, undermining its integrity. The collapse of the tree at the end is “unexpected”. As the financial system rots, people increasingly discount monetary metals for future delivery.
With a rapidly withdrawing offer in spot gold, and at the same time an increasingly reluctant bid especially on far futures, there would be a large backwardation that is greatest the farthest out on the [yield] curve."
"Permanent backwardation is when all futures contracts fall below the spot price, and the gap keeps widening no matter how much the price rises."
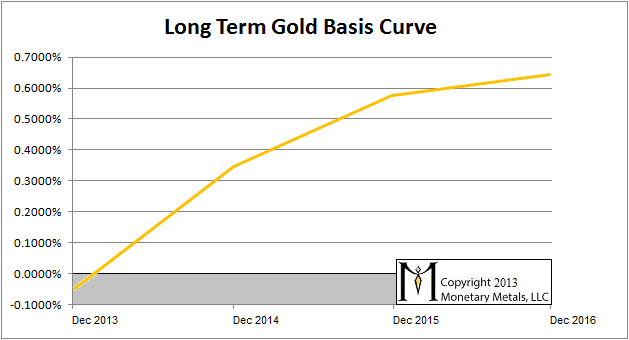
Long Term Gold Basis (yield) Curve: there is a temporary backwardation in 2013, but still not a permanent (or long term) backwardation (source)
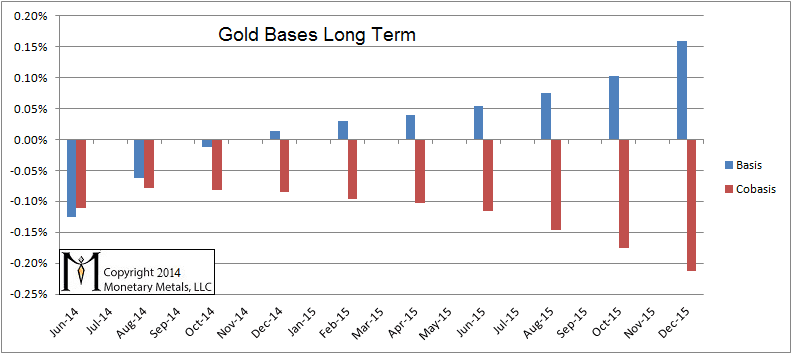
June 2014 to Dec 2015 futures contracts: Gold Bases and Cobases (source) as measured 4/25/2014
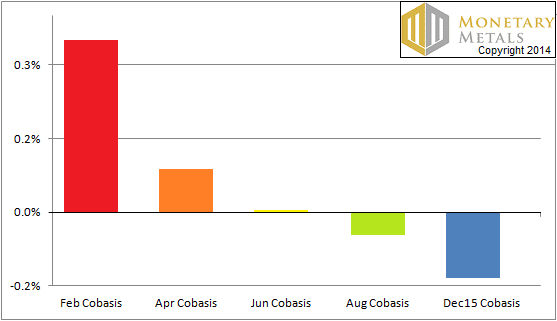
Feb. 2015 to Dec. 2015 futures contracts: Gold Cobases on 11/30/2014 (source)
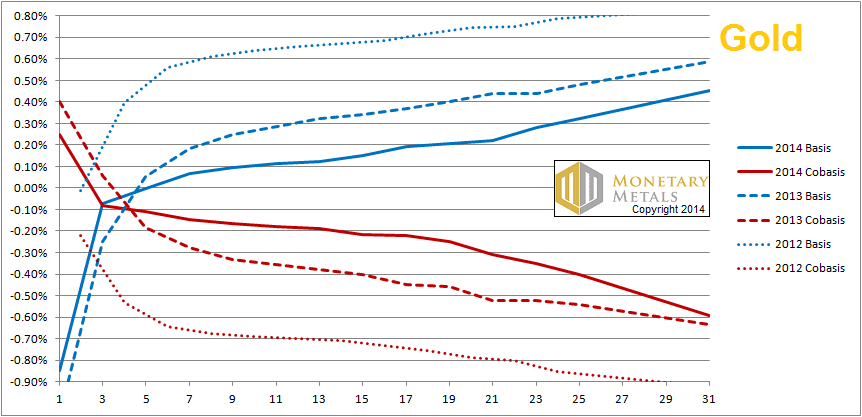
2012 to 2016 futures contracts: Gold Bases and Cobases. The solid blue and red lines are the basis and cobasis on 05/30/2014. The bottom axis is labeled with contract months starting from May (1 means June, i.e. 1 month from May; December year n is 7, Dec. year n+2 is 31). (source)
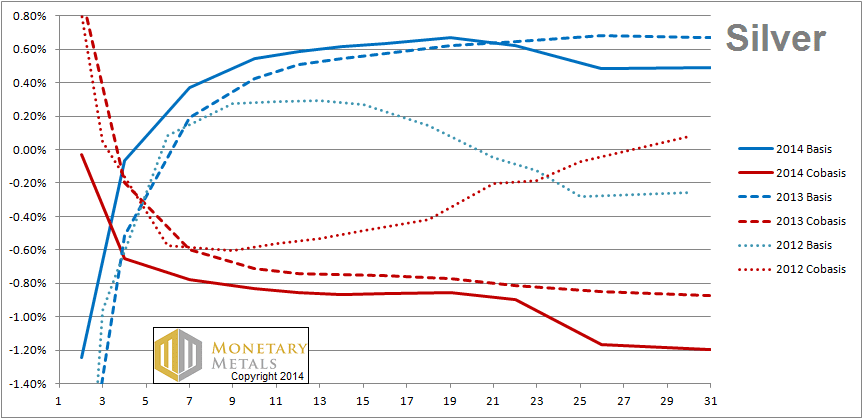
A fading long-term silver backwardation : 2012 to 2016 futures contracts: Silver Bases and Cobases. The solid blue and red lines are the basis and cobasis on 05/30/2014. The bottom axis is labeled with contract months starting from May (1 means June, i.e. 1 month from May; December year n is 7, Dec. year n+2 is 31). (source)
* "Permanent backwardation is when all futures contracts go into backwardation, and no matter what happens with the gold price (probably rising quickly), the backwardation increases. This is the first step of gold becoming unavailable to the market. Why should people who own good gold bid on bad paper, once it is obvious that the paper is being dishonored? But those who hold paper will still want gold. Increasingly, they will trust only gold metal. So in the gold futures market, the bid is falling and in the physical gold market, the ask is rising. The destruction will come when people discover that so long as they can use their paper money to buy commodities like oil. This will give them a back door to gold. Gold will still bid on commodities, even when it does not bid on paper money. This commodity arbitrage (paper for oil, oil for gold) will drive the price of oil to rise exponentially when measured in paper, and down nearly to zero when measured in gold. And the same will occur for every commodity. People will call this “hyperinflation” but it will have nothing to do with the quantity of money, nor will it be driven by consumers competing with one another to buy bread with wheelbarrows full of paper money. It will be the last chance to trade paper for a little gold, and the end of the paper currencies.
We should look for the following signs. The interest rate on the long-term bond approaches zero (which means the Net Present Value of the debt approaches infinity). The gold price is rising exponentially, especially if the cobasis is rising across all contracts. The duration of government bonds held by the public is approaching zero (people are unwilling to take the risk of holding long-term debt). All net new issuance of government debt must be purchased by the central bank. The central bank’s balance sheet becomes filled with illiquid, long-term assets at overstated values, and people call it into question and judge it insolvent (when people withdraw their trust of the bond, they will not jump out of the frying pan and into the fire by trusting the paper currency backed by the bond). And real capital is being destroyed, with rising bankruptcies, many of which are unexpected (like Bear Sterns)." Source, 08/12/2013.
Norcini: "trying to construct a gold basis chart is a bit difficult to do. One of the reasons is because the basis, which as Antal correctly defines as the difference between the front month futures contract and the cash or spot price, must be defined at the exact same moment in time due to the wicked volatility of the futures market. The gold futures market generally is moving much faster than the spot price of gold. To get an accurate reading of the gold basis then is very difficult at times due to the lag. Some of you might have noticed this when you have been recently making purchases of gold and are getting a spot price off of a web site such as Kitco and looking at the futures market price. You can see the difference."
* GOFO (Gold Forward Offered) rates are the rates at which dealers will lend gold on a swap against US dollars.
Most of the previous content of this section has now been moved into this article.
Derived Gold Lease Rate = LIBOR minus GOFO.

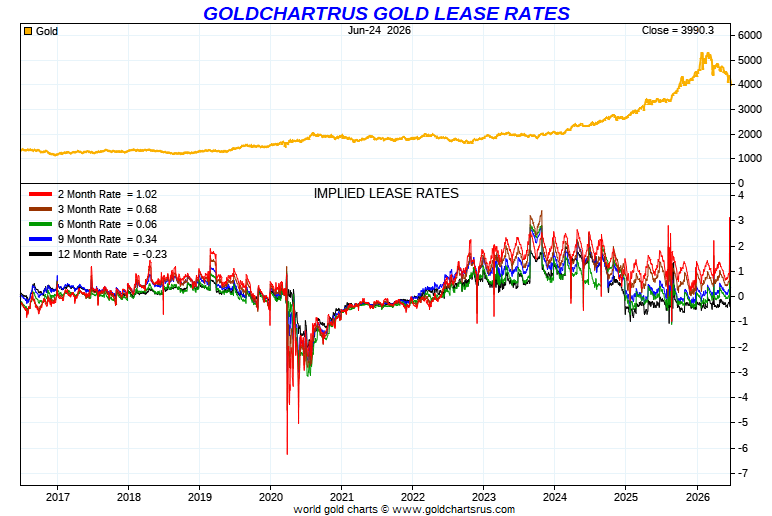
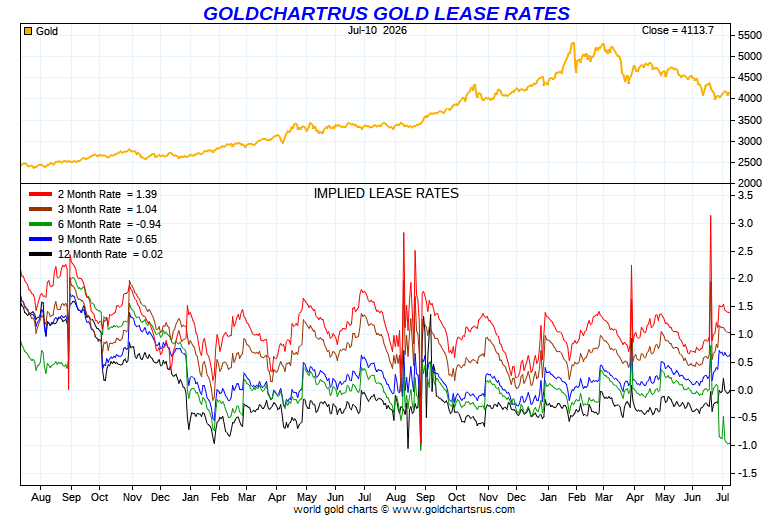


Gold Lease Rates, 11 years moving
Gold Lease Rates, 2 years moving data series

GOFO rates and "Paul's channel"; data series from 01/01/2010, with zoom till 12/19/2013; LBMA data compiled by conscience-sociale.org; This chart is updated monthly on our original article's page.
From this trend, we can anticipate when 12-month GOFO Rate will become negative (cf blue downtrend channel above, with dash line). It will be the second time since the opening of gold futures (or Gold forward) market. I've discussed this anticipation in this article published some months after a first version of this chart went online on our Gold Basis page.
If the FED/BoE would try anything (to cut or accelerate QE3, to make the price of LBMA fixing gold or LIBOR to peak or fall...), the upper limit of this time frame will be even shorter because downwards trend will accelerate.
- 2013 latest GOFO rates and others historical data :

GOFO 1M, 2M, 3M, 6M rates turned negative between 7/08/2013 and 9/12/2013 almost continuously.

Since inception 07/1989, GOFO rates turned negative only 3 times before 2013, but never so long.
1M, 2M GOFO rates turned negative from 11/20/2008 (source) but only for 3 days in a row :

In sept. 1999, 1M to 12M GOFO turned strongly negative but only for 2 days. Wednesday 29 Sept. 1999 is until now the only day where 12M GOFO was negative in LBMA history. It was the apex of the 1999 gold crisis:

We should note the 1999 gold crisis did not happened only for 2 days. The GOFO chart for this year depicts this clearly: observe how the GOFO 1M-12M spread evolve between Sept. 97 and Dec. 99.
There are several events to record here :
- the announcement of UK gold sale by BoE and Gordon Brown on 7 May 99 (i.e. : a crime of high treason against the english people; or watch this documentary about Brown's Bottom)
- the first gold auction on 6 July 1999; and others 16 auctions from July 1999 to March 2002
- and the major first Washington Gold Agreement (CBGA) signed on Sunday 26 September 1999

GOFO, data series Y1999;
source: Conscience-sociale.org using LBMA data
By the way, there are some very intriguing questions with these GOFO charts, but I never read someone writing about them. Here they are:
- why were these values positive from April 2004 to Oct 2006 then turned negative: about this we can observe that FF rate increased between end of 06/2004 and beginning of 07/2006, but LIBOR 12M started to increase April 2004 and the spread LIBOR 12M-1M turned negative in Oct 2006
- why were the values of GOFO 12M-1M positive again starting April 2008 till today? I don't think it was directly related to GLD opening, or to Rothschilds and AIG withdrawals, but here again to the spread LIBOR 12M-1M
- and the last: why were the values of GOFO 12M-1M negative between the beginning of the public record 1989 (except for some days of gold crisis) and April 2004, and did not evolve according to the spread LIBOR 12M-1M?

GOFO, data series 1997-2004; source: Conscience-sociale.org using LBMA data


LIBOR 12M and 1M in US$; 5Y and 10Y moving data series; updated daily
In 1995 GOFO turned briefly negative :

--------------------------
* Beyond the screwed Gold Basis :
What is the relation between Gold Basis and GOFO rates ? The answer is basisGOFO.
GLBR (Gold Lease Bid Rate) est la moyenne quotidienne des taux d'intérêt que les candidats sont prêts à payer pour les lingots d'or loués;
GLOR (Gold Lease Offered Rate) est la moyenne pondérée des taux d'intérêt auxquels les participants du marché sont prêts à louer des lingots d'or qu'ils possèdent.
Ces taux sont cotés sur le marché avec un écart d'environ 20 points, soit GLOR = (GLBR - 0,20%) (source: LBMA/LPPM Page 21). Pour les GLOR et GLBR il n'y a pas de processus formel de fixation. Au lieu de cela, la LBMA calcule quotidiennement une moyenne pondérée de taux d'intérêt GOFO. Le calcul de la valeur moyenne exclut les valeurs des taux les plus élevés et les plus bas, comme pour le LIBOR. Basé sur le fait que les taux d'intérêt sur les prêts et les dépôts d'or sont négociés avec un écart en moyenne de vingt points de base, on peut faire une approximation des valeurs moyennes de GLBR et GLOR :
GLBR = (GOFOmoyen + 0,1%)
GLOR = (GOFOmoyen - 0,1%)

LIBID (London Interbank Bid Rate) est la moyenne des taux d'intérêt pendant la nuit, au cours de laquelle les banques sont prêtes à accepter des dépôts d'autres banques. Il est publié en même temps que le LIBOR.
Pour le LIBID il n'existe pas de procédure formelle de fixation, il est supposé que approximativement LIBID = (LIBOR - 0,125%). (source)
On peut alors calculer cobasisGOFO = LIBID - GLOR = LIBOR - 0,125 - GOFOmoyen + 0,1 = basisGOFO + 0,075 c'est à dire une simple relation de translation, conséquence des approximations que nous avons prises ici.

Si on dispose d'un accès à un historique des valeurs LIBID, GLBR, GLOR on peut alors déterminer précisément l'évolution actuelle de (co)basisGOFO en période de crise du marché.
2. Gold in Asian markets (SGPMX, SGE, TOCOM, MCX, SHFE, CGSE, HKMEx, SGD)
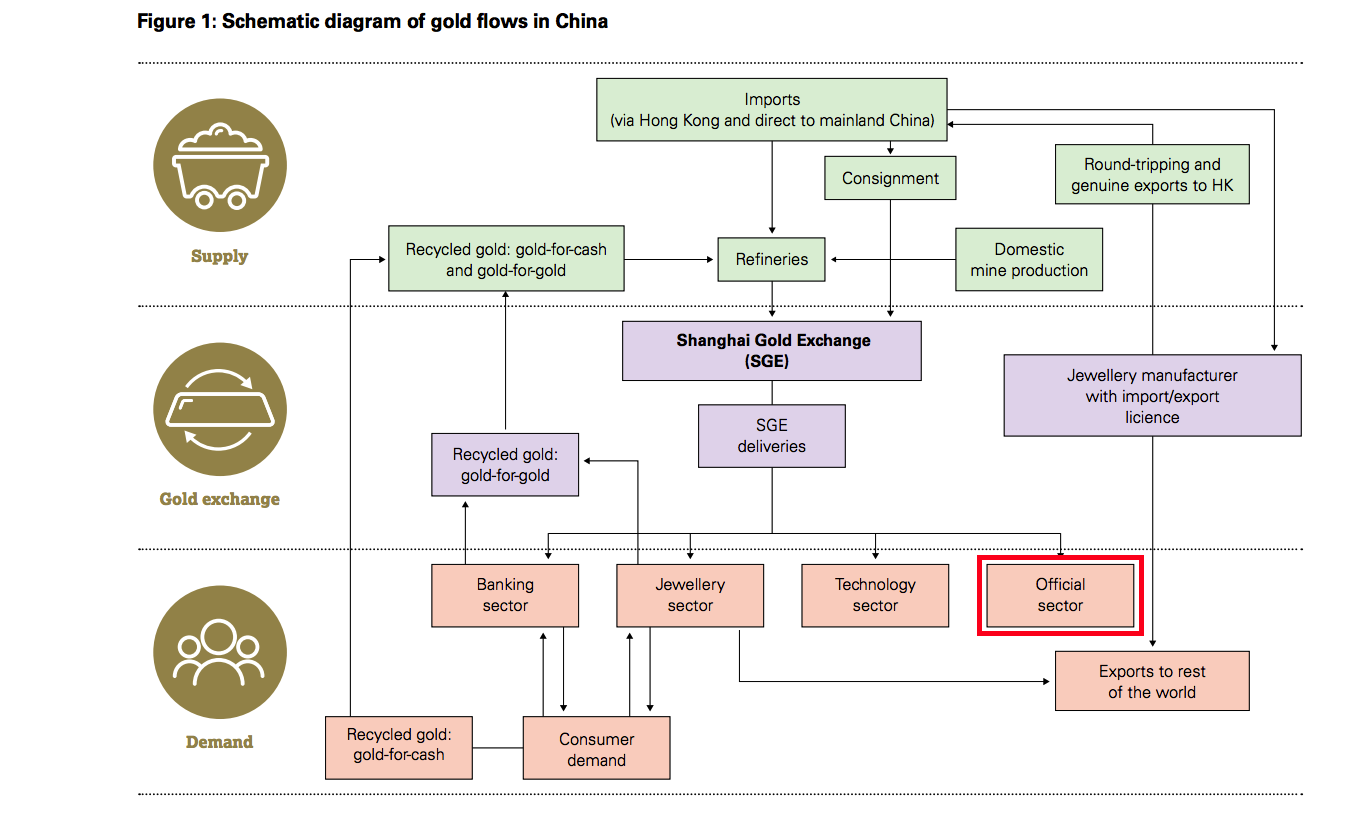
- Analysis of the gold market seen by chinese people
- In 2010, the top 3 commodity exchanges that trade gold averaged $24.3 b. in daily gold trading volume (or 19.8 M. troy ounces). COMEX began to offer trading in gold futures contracts in 1974. More than 70% of all gold futures volume are traded on COMEX, where gold futures contracts exchange was launched on 31 December 1974. Tokyo TOCOM has been trading gold since 1982, India MCX since 2003.

- The Shanghai Futures Exchange (SHFE) introduced gold futures contracts to the Chinese market 1/9/2008. With NYSE LIFFE Exchange they are the next largest exchanges with trading metals futures, and are followed by many smaller exchanges around the world. CME Group has a relatively small market share of metals futures, but as of 03/2010 a dominant control over 100-ounce gold sold at the COMEX, a division of the CME subsidiar, New York Mercantile Exchange. In March 2010, it traded 4.4 million gold contracts, a total of 13.6 million kilograms. In contrast, Shanghai traded approximately 49,000 kilograms.NYSE LIFFE has an even smaller U.S. market share of gold futures. It posted a 1.28 percent market share in the same contract last month.
.jpg)

- Sep. 2012 SHFE has reported the first physical delivery on a silver futures contract through its own platform. April 2012, the silver futures were introduced as an alternative investment instrument for China’s private investors, and to allow China to influence the global silver price. China is the world’s largest silver producer after Mexico.
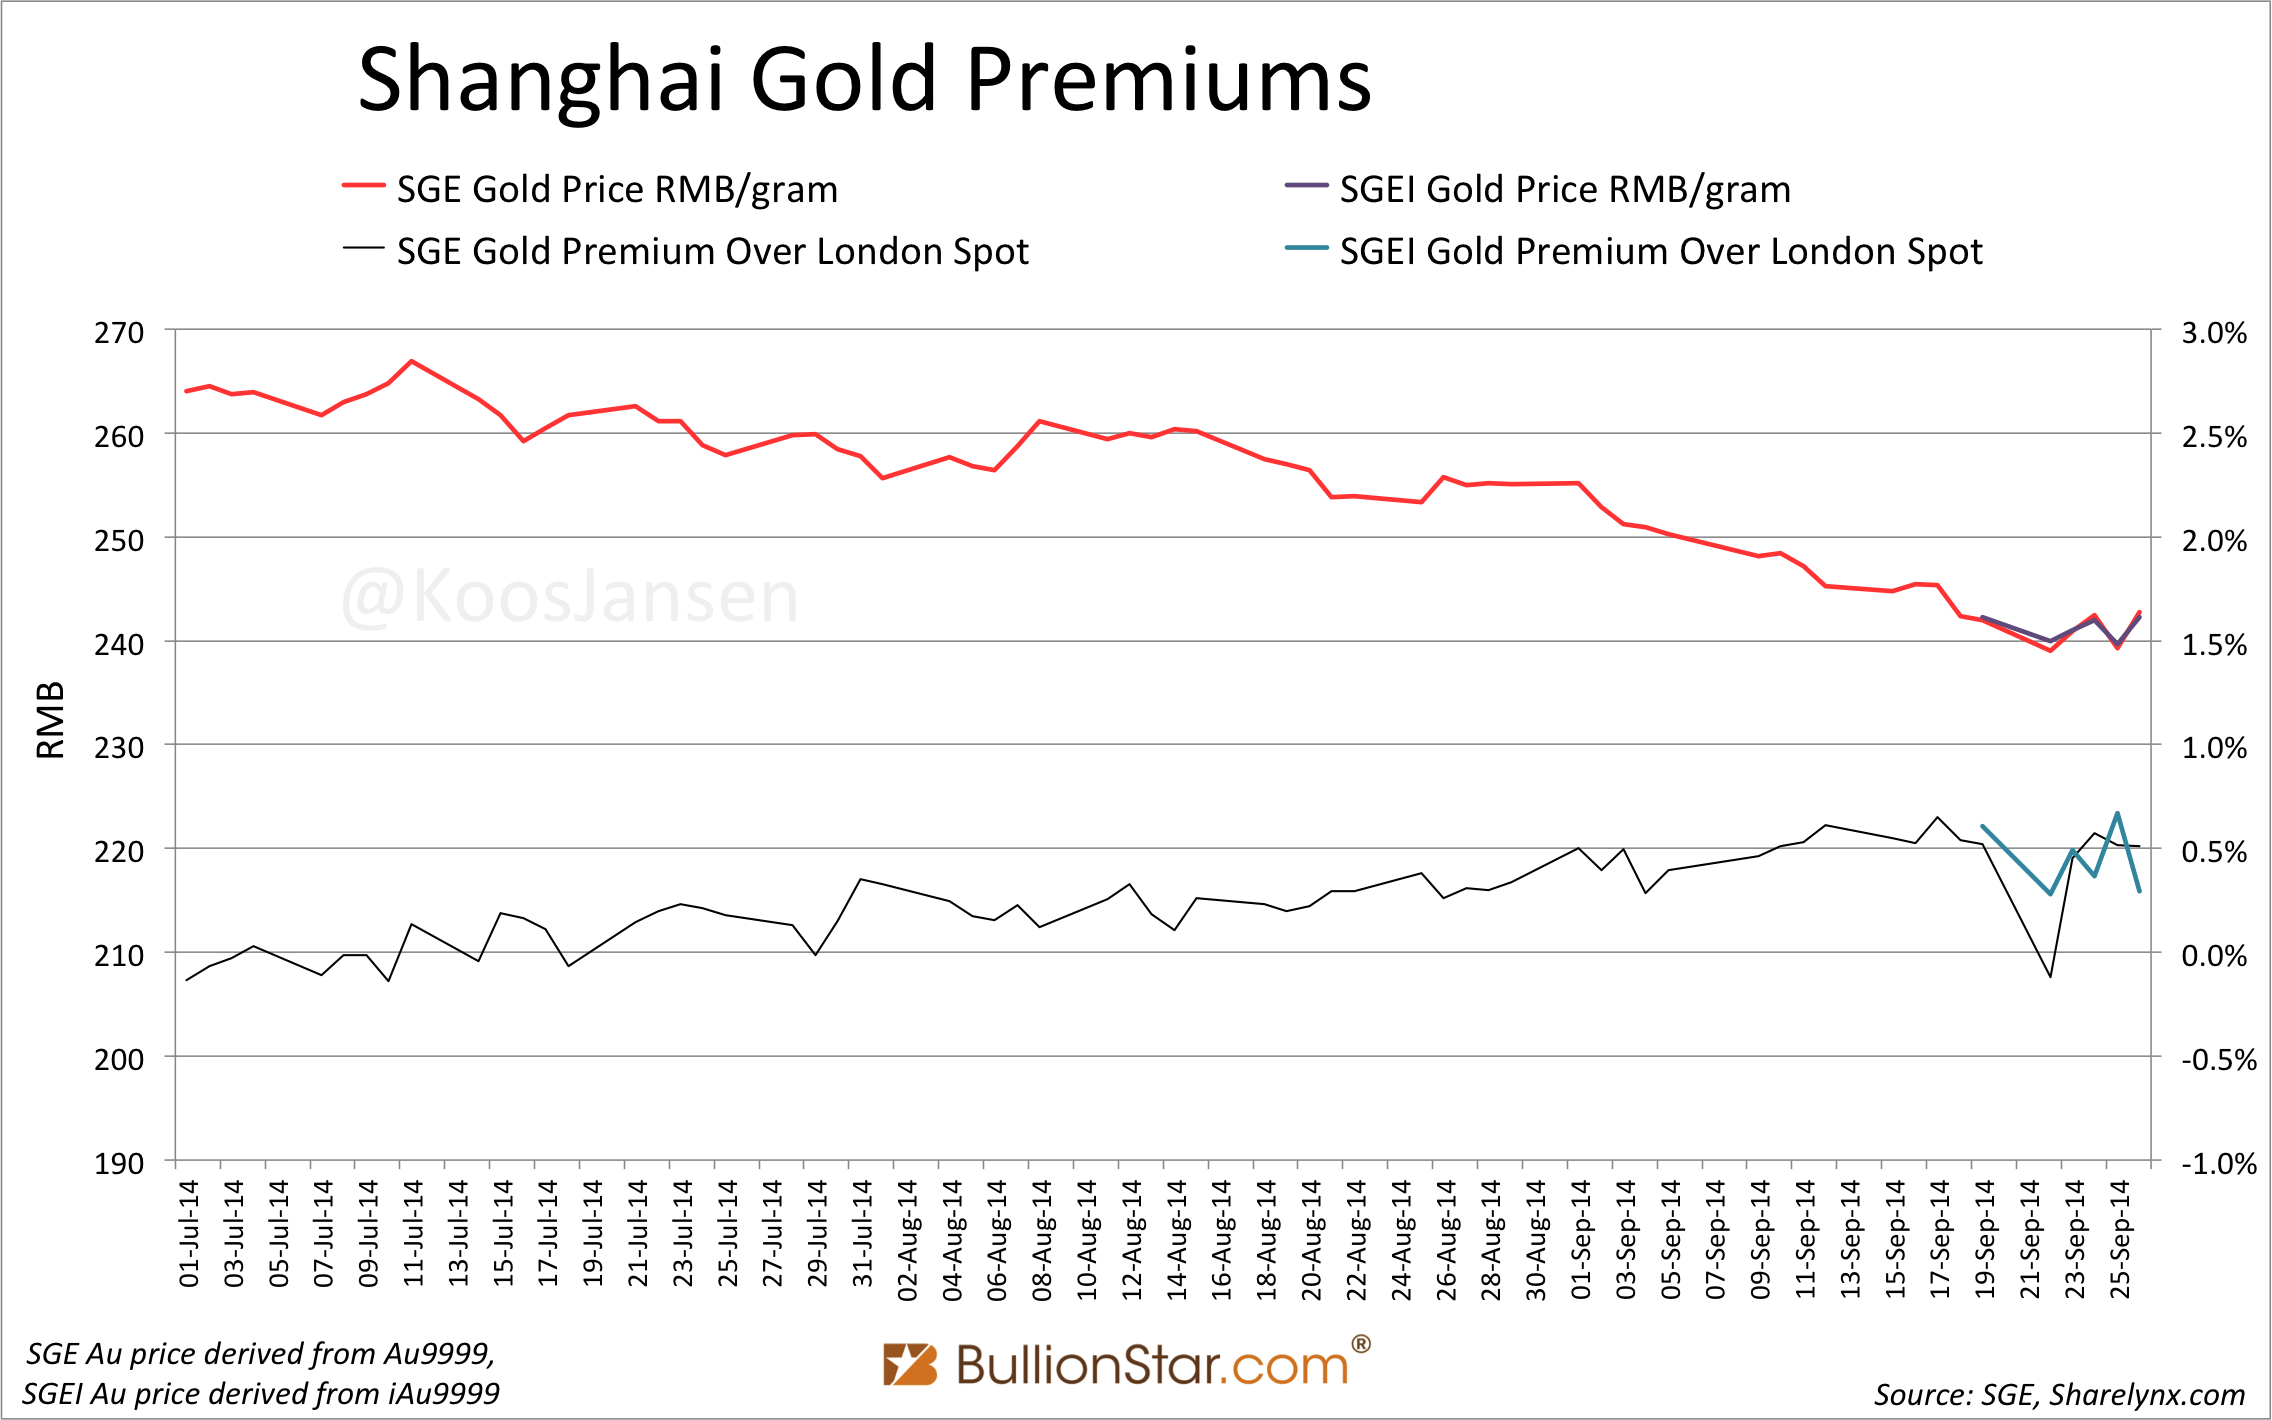
- 9/18/2014 SGE opened of the International Board of gold traded in yuan. China is the world’s largest gold producer and consumer.
- Singapore SGPMX
1Y Gold Price in U.S. $/oz
SGPMX is the world's first precious metal exchange opened that is fully backed by physical precious metals.
- The SGE currently (09/2014) has a network of 58 Certified Vaults (of which 55 are for gold storage and three are for silver storage) in 36 cities nationwide covering all major gold refinement and consumption regions, providing physical delivery, transfer, logistics, and transport services to enterprises and individuals across the country. Meanwhile, International Board Certified Vaults provide additional services relating to the transshipment of physical gold bullions between two foreign trading parties. Read SGE rules (article 40) for how the transaction price is determined.
- Shanghai Gold Exchange (SGE): delayed quotes, daily prices, weekly and daily physical deliveries report, monthly data , historical daily benchmark prices (csv) (note: SGE new website is better seen with firefox browser)

Au99.99 contract: price trend

iAu99.99 internationally traded contract: price trend
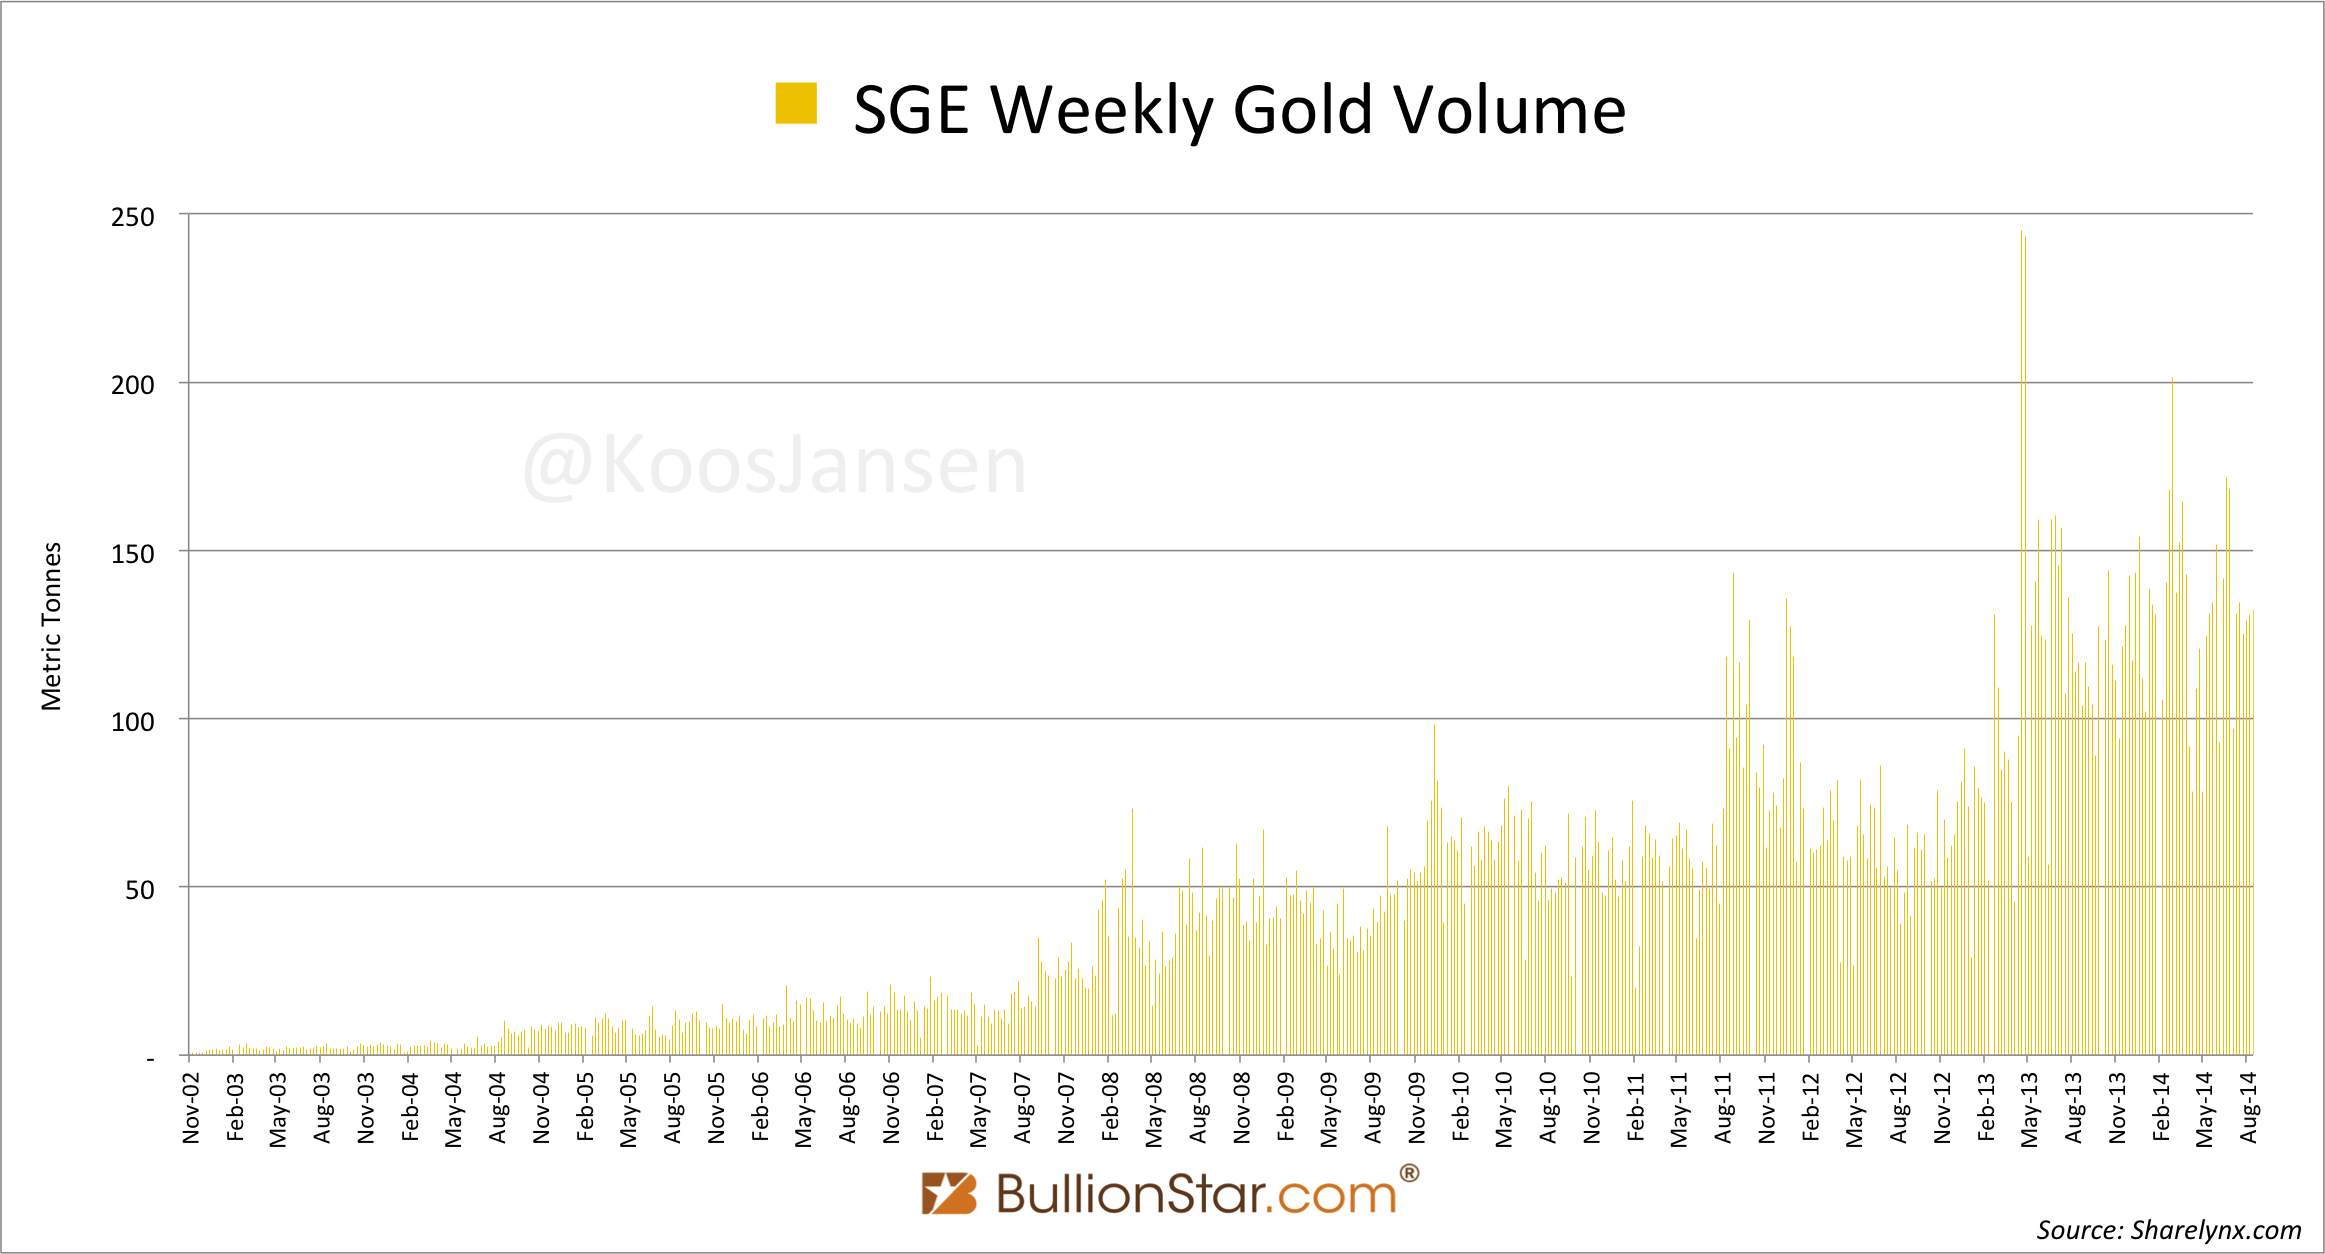
- SGE: gold trading volumes and amounts


source: cdfund.com

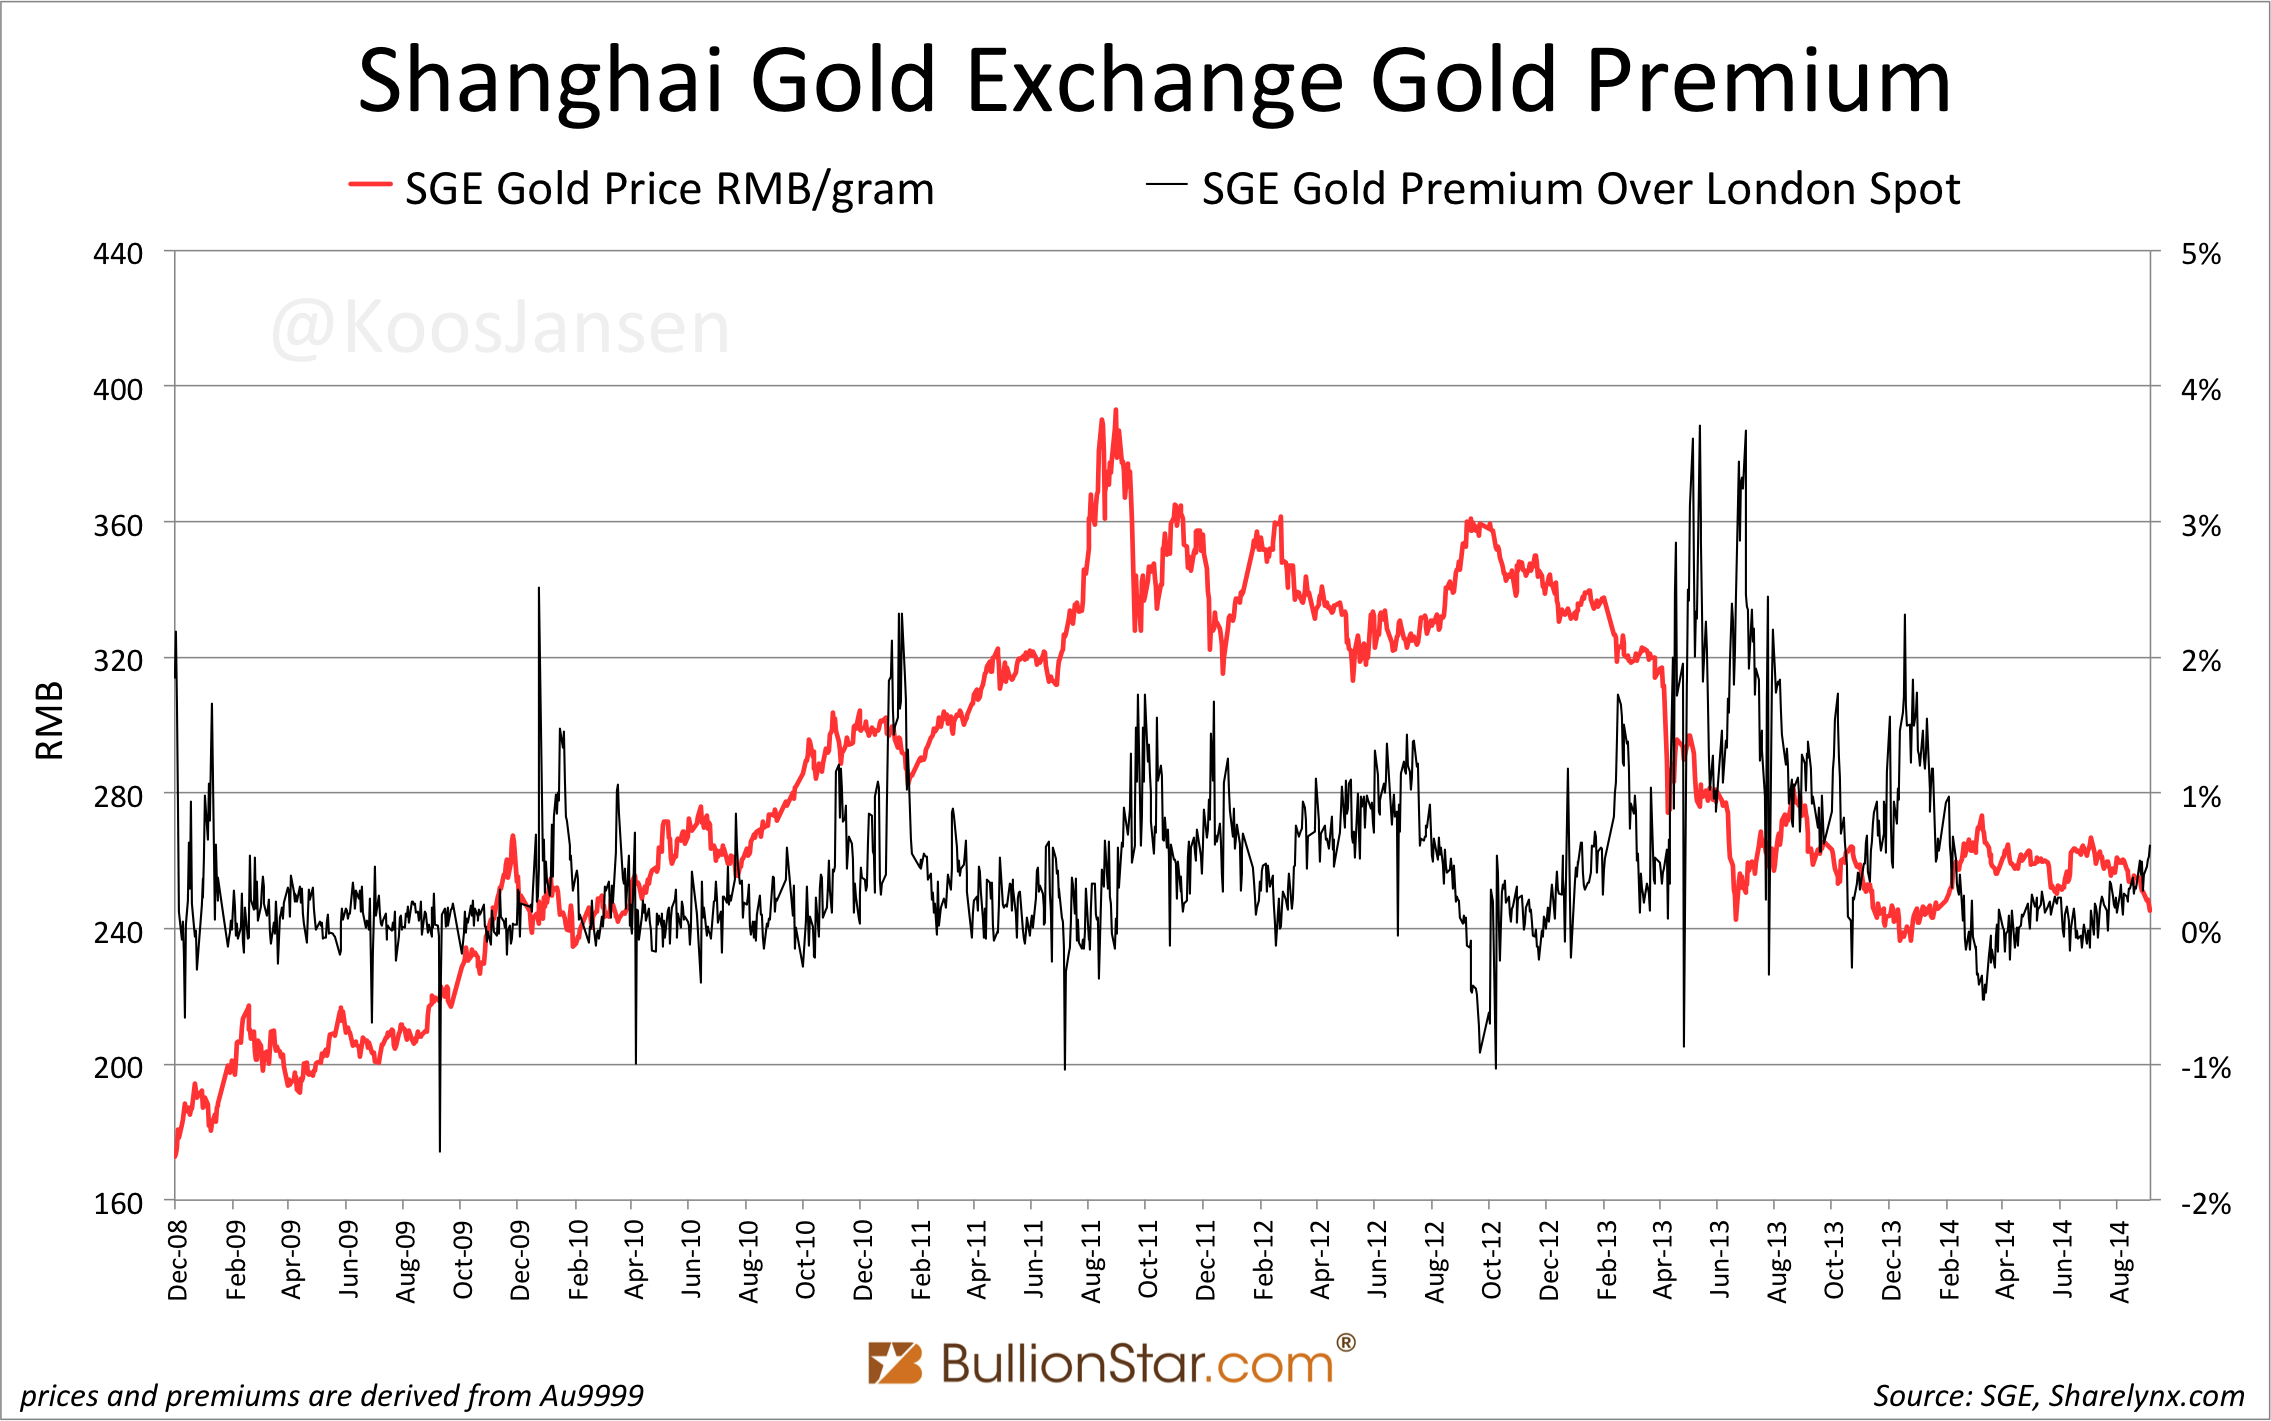
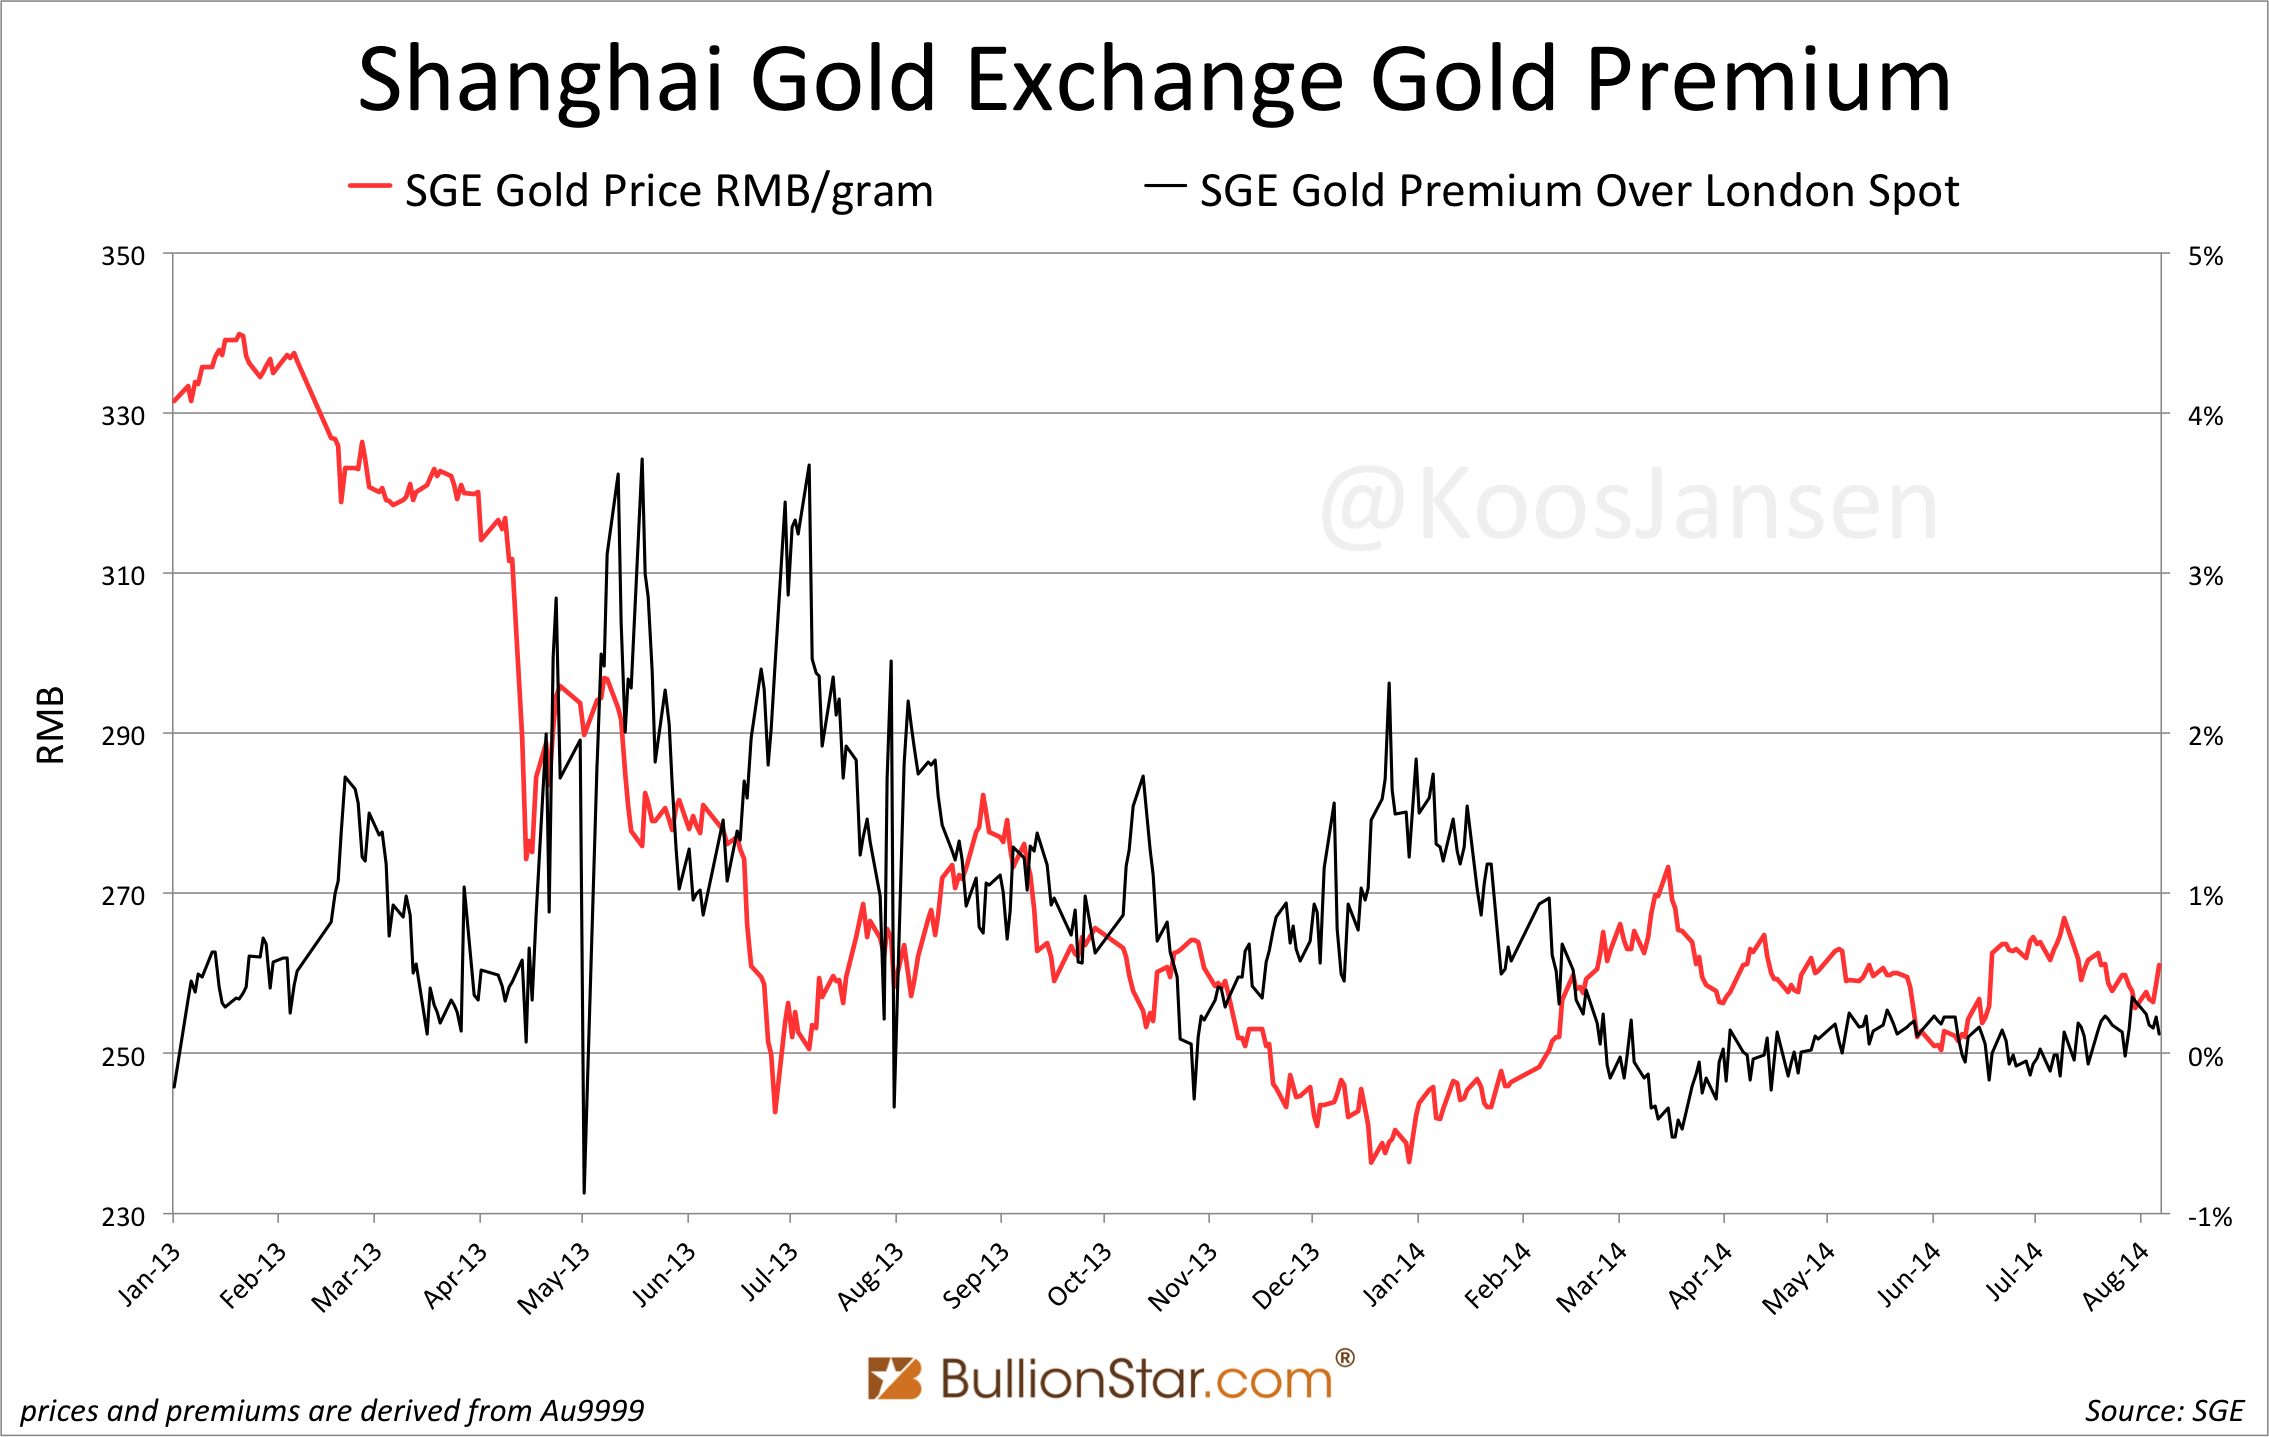
data series since 2003; source: SGE


 Daily gold trading volumes in SGE, COMEX, LBMA;
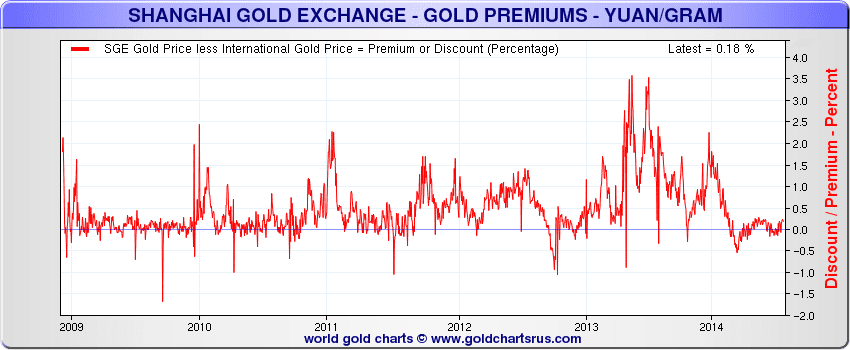
data series since April 2009; source


source: goldchartsrus.com
source: the real asset co.
source: BullionStar
data series since April 2009; source
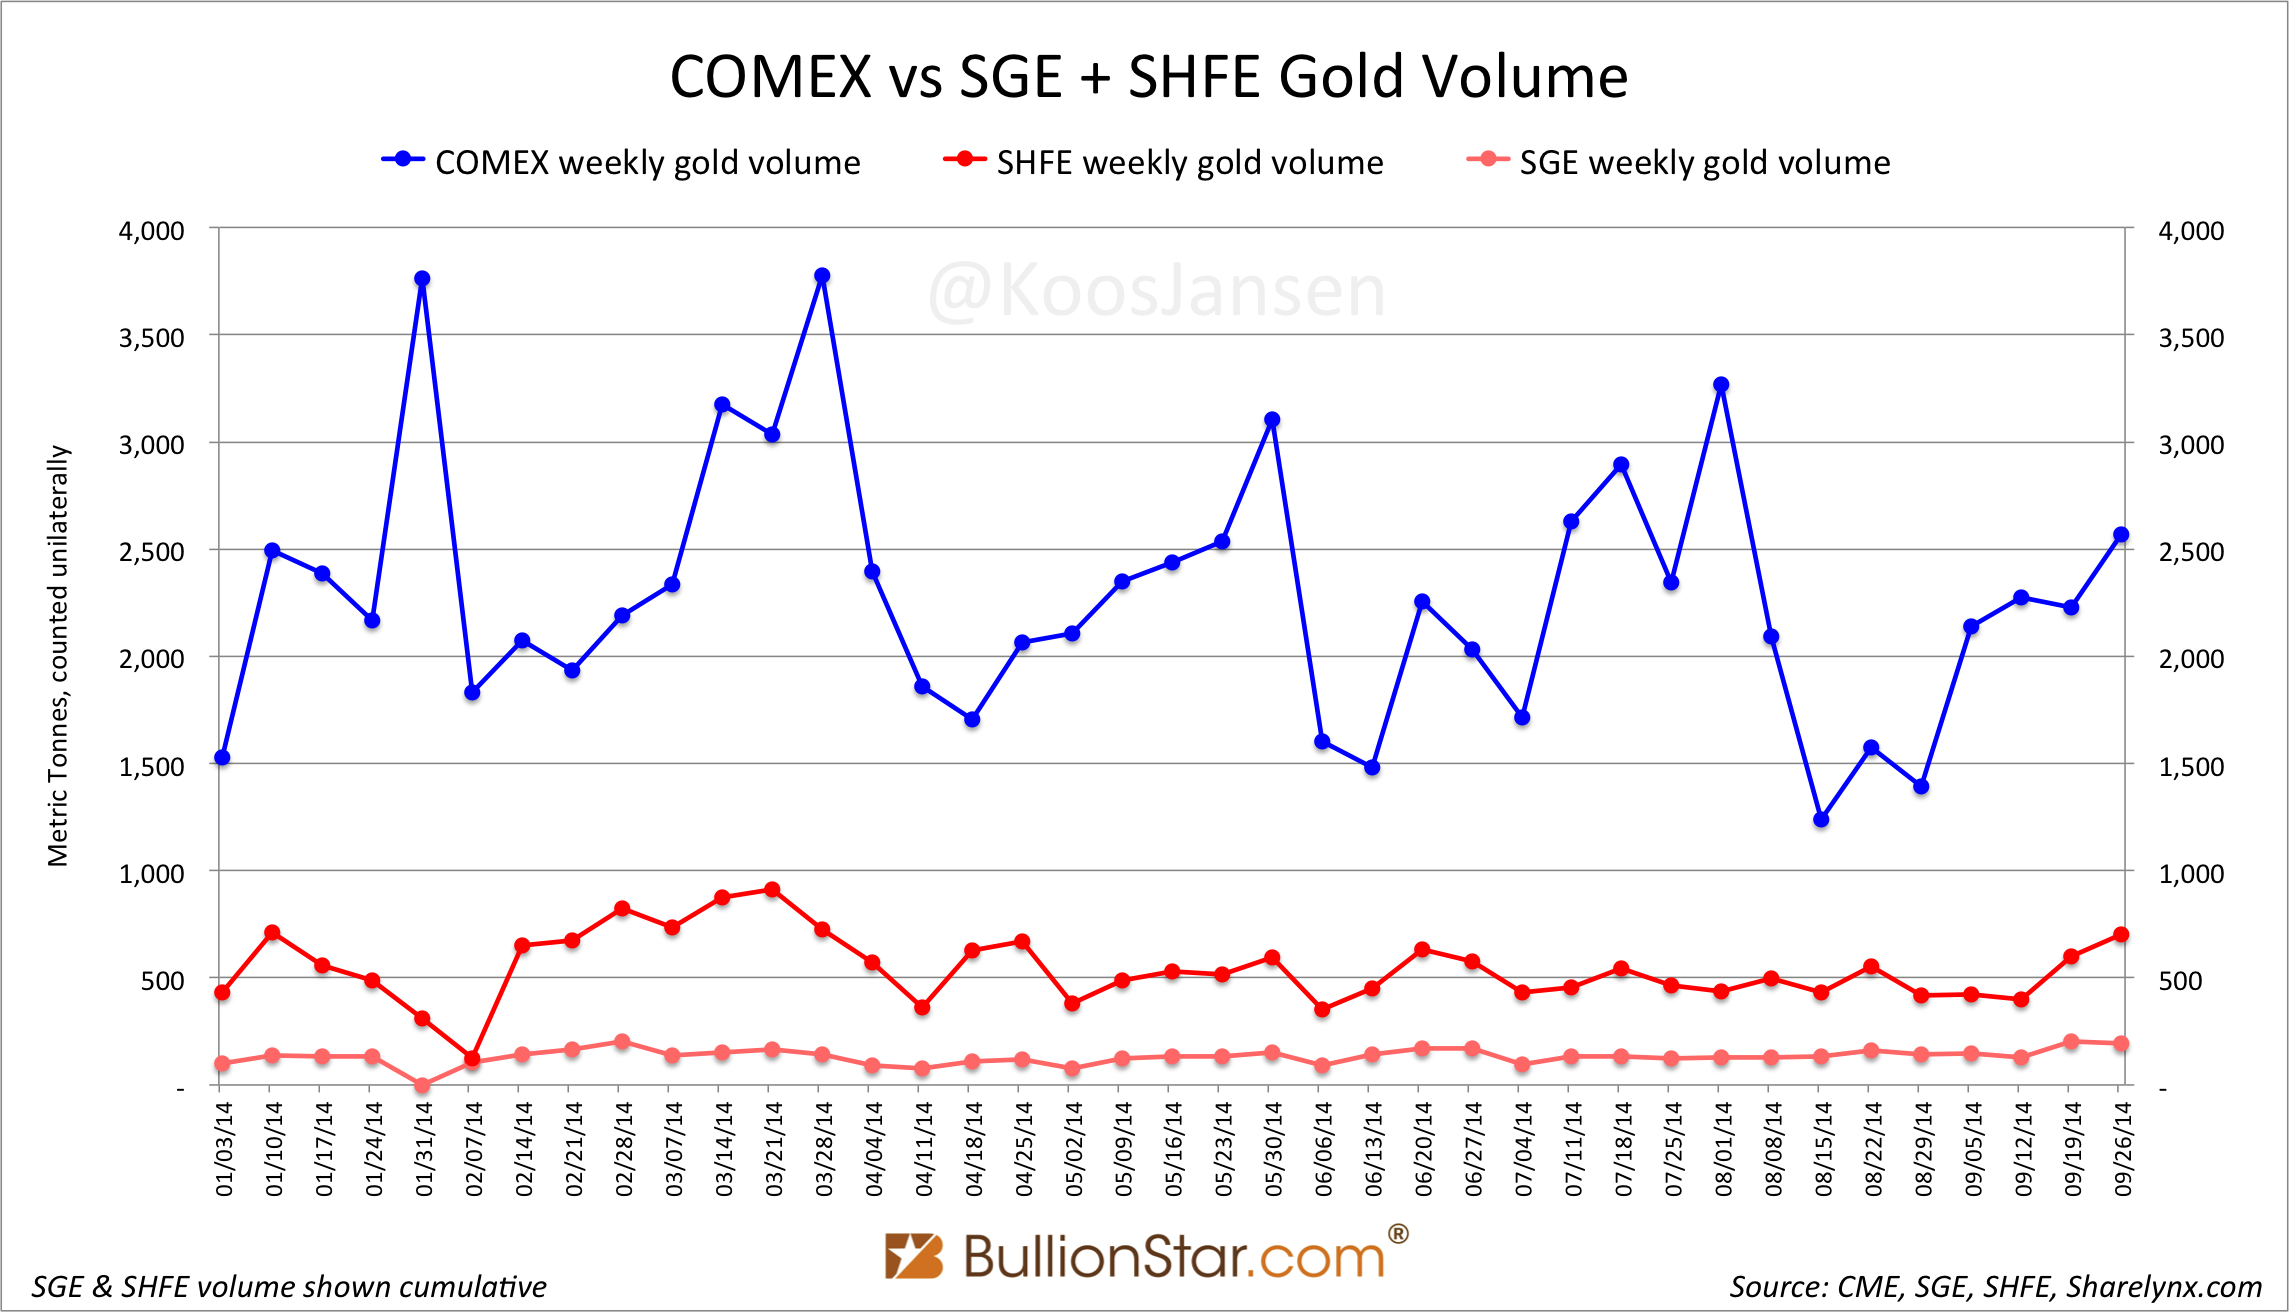
Daily gold trading volumes in SGE, SHFE, COMEX;
data serie since 2002/11; source 1, 2
source: InGoldWeTrust.com
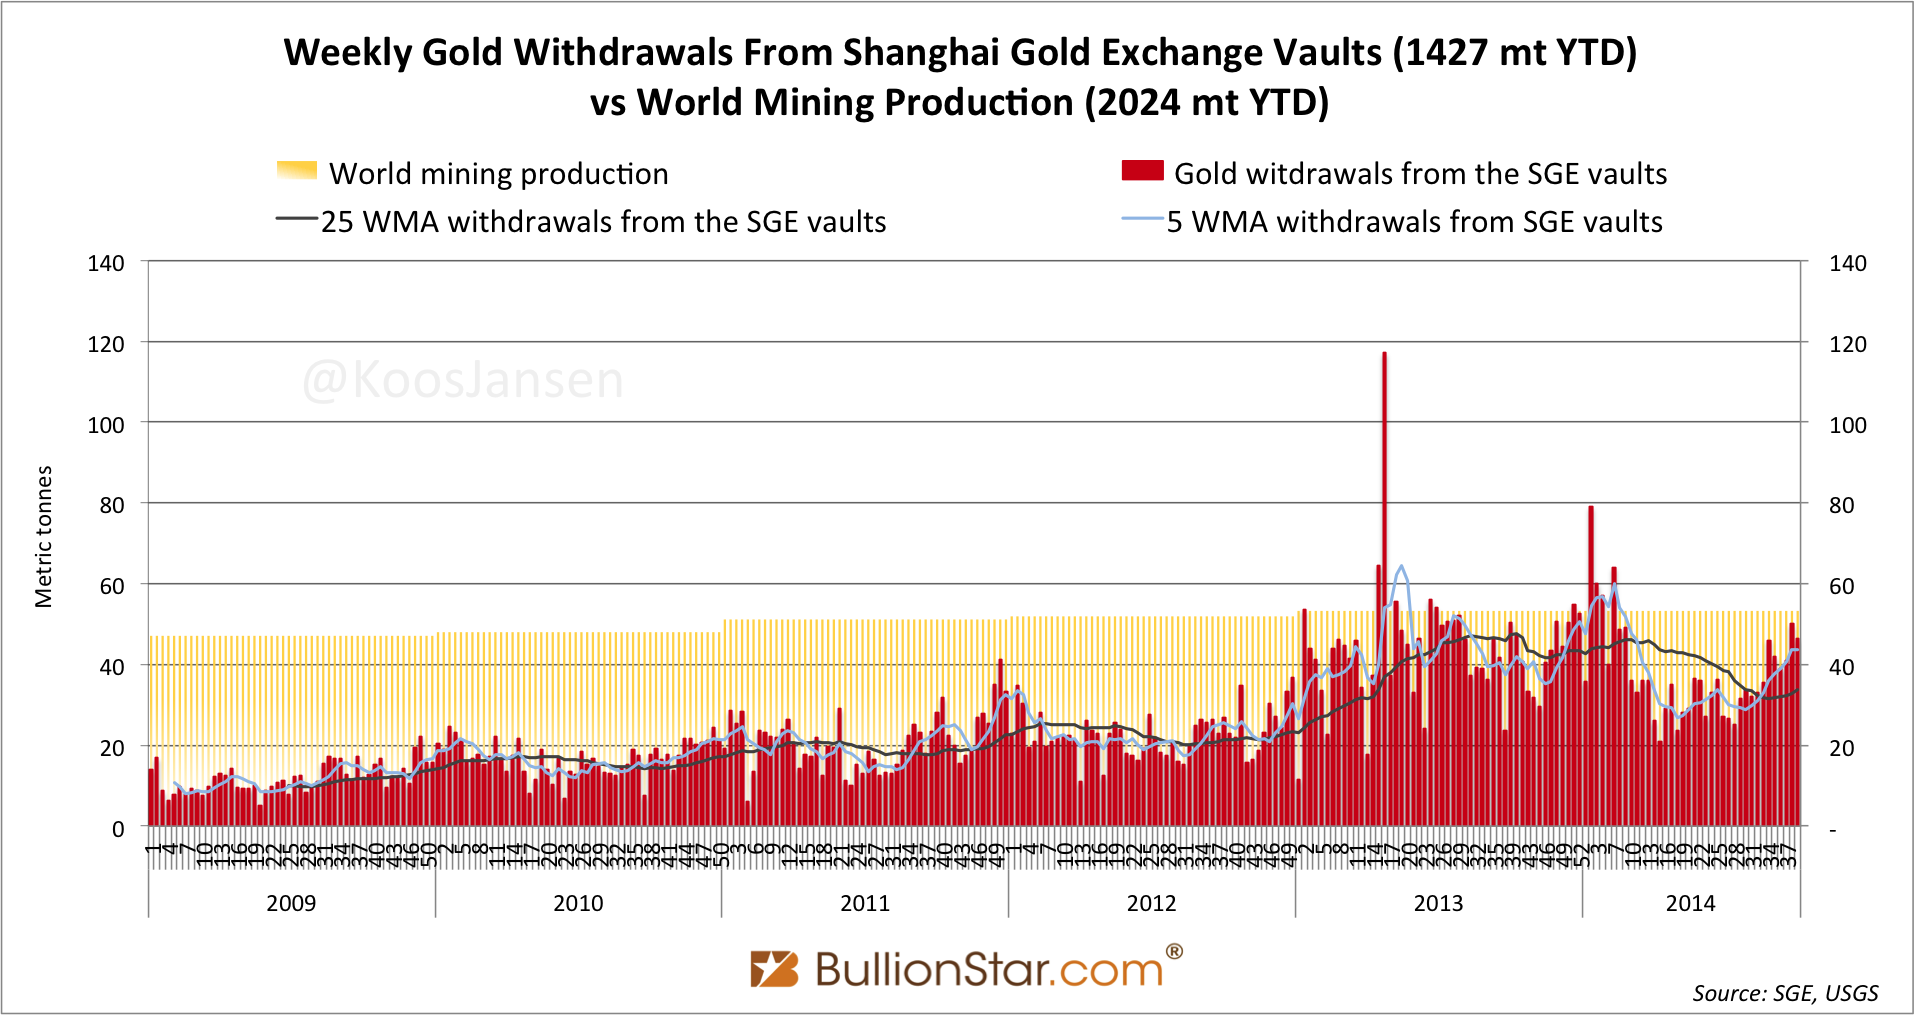
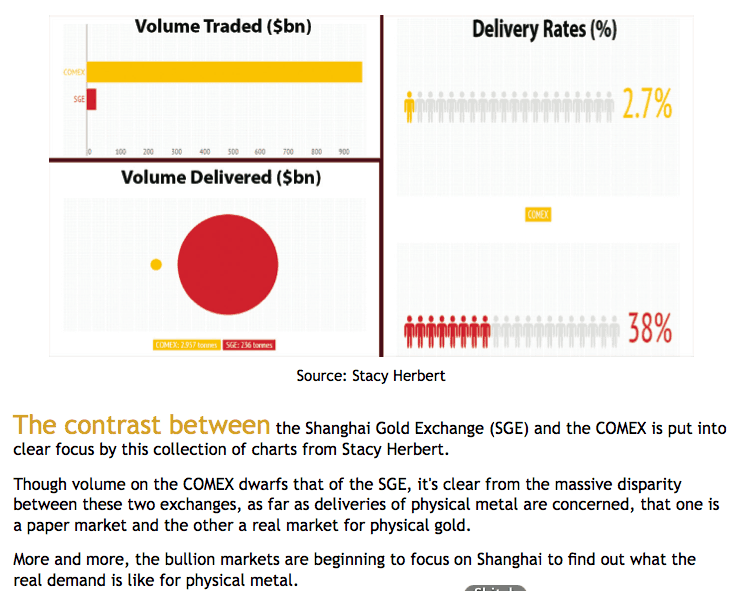
- Others infographics about Comparisons between COMEX and the Shanghai Gold Exchange
- SGE Physical Delivery From Vault: SGE and SHFE Versus COMEX


SHFE Gold December 2014 futures contract (VHZ14) as of Sep 30th, 2014, weekly data; source
* SHFE AU1 continuous contract #1 : historical data (eod, yuan/g)
* Bid & Ask intraday quotes for SHFE gold futures: source

Price evolution for the most heavily traded futures contract on COMEX and SHFE; 2Y data series, 2010-2012
The resolution of the data is minute-by-minute, over two years. The COMEX quotes are converted to the Chinese RMB from US dollar. (source)

* SHFE silver market


* Russia :

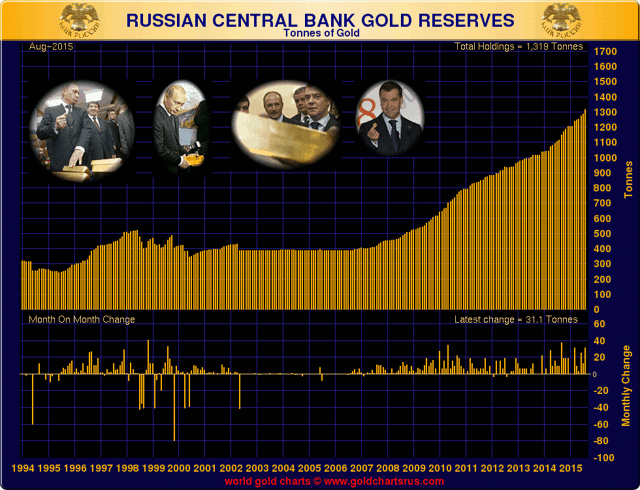
Russia gold reserves, 1994-2015/08, monthly data; source


* India :


source: InGoldWeTrust.ch


* China :
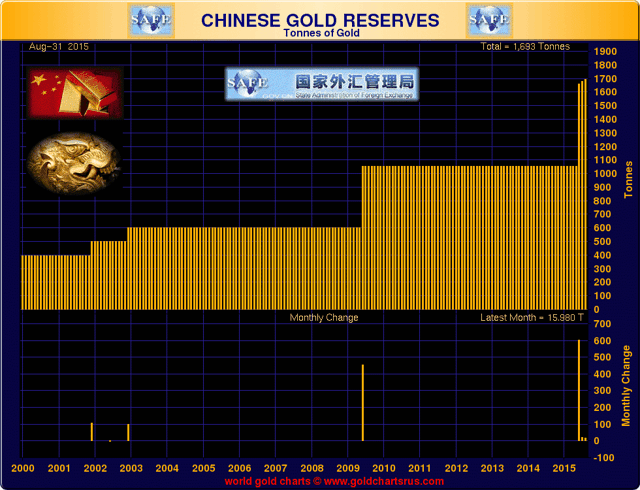
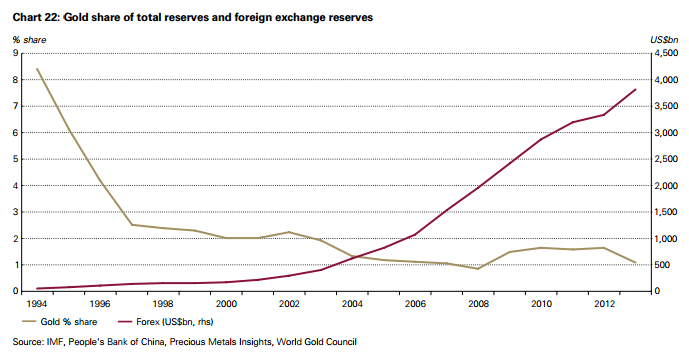
China official gold reserves, 2000-2015/08, monthly data; source
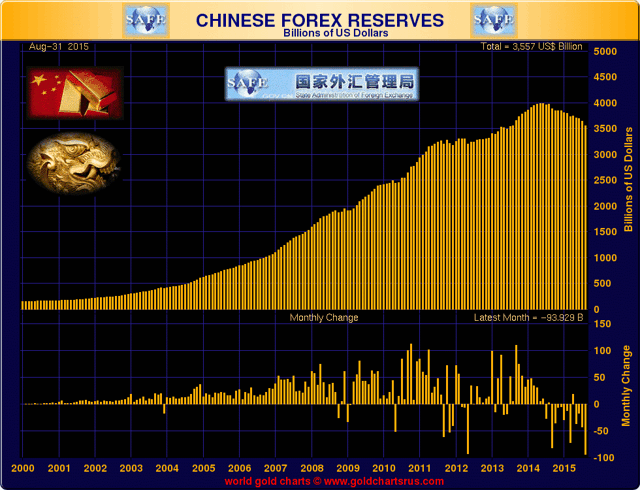
China official forex reserves, 2000-2015/08, monthly data; source


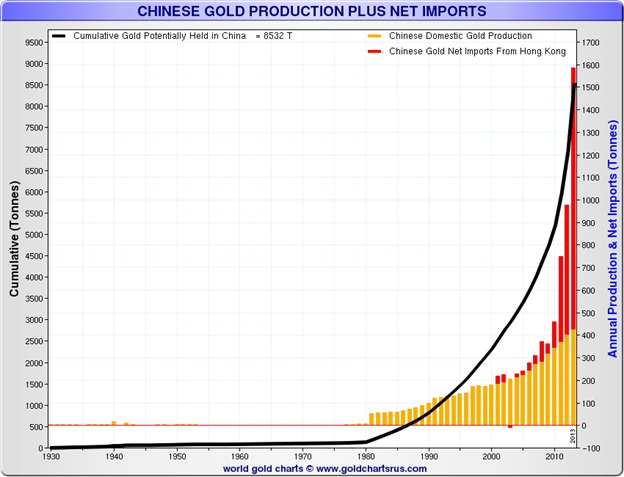


Official data from WGC ; source

Source: Conscience Sociale, using May 2013 WGC data
- "A 2012 paper, ‘A Study on Optimal Scale of China Gold Reserves’ co-authored by the Vice-President of the China Gold Association recommended that by 2020, China’s optimal reserves should be 5,787 – 6,750 tons. If the State Council has followed this recommendation then the PBOC should currently hold between 2,947.2 tons and 3332.4 tons of gold in reserve." (source, 10/3/2013)


3. Gold in Western markets (COMEX, LBMA/LME)
* the rigged western gold market :
source: goldchartsrus.com
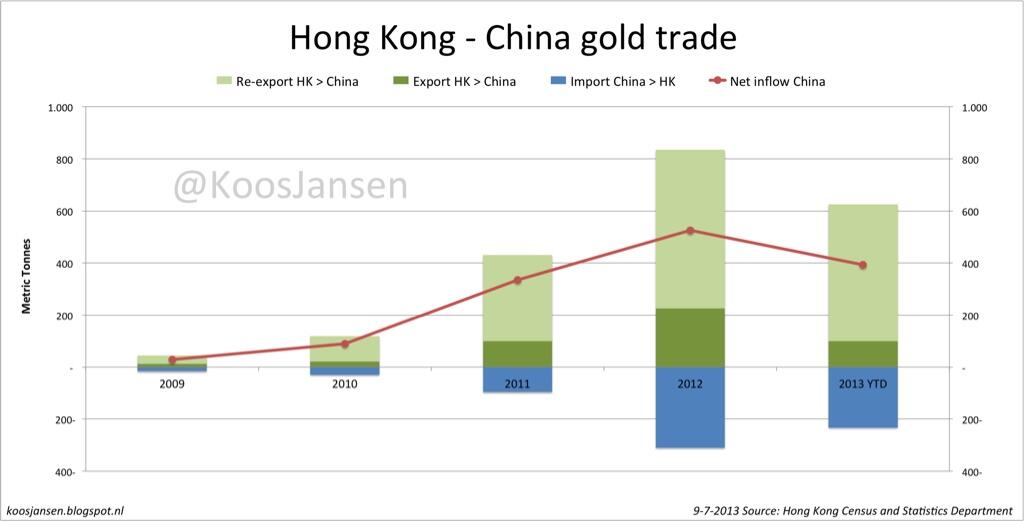
* UK gold trade 2008-2013 Q3 :


* Comparison between COMEX and LBMA :

* Intraday bid and ask spot prices by GoldSeek:
* Intraday spot gold bid price by Kitco:


* LBMA fixing prices (different currencies)
- In addition to the fixing prices, two-way gold spread prices are offered by members of the LBMA during each trading day. These spread prices include a low (bid) prices and a high (offer or ask) prices.
* LBMA releases clearing statistics each month showing the net volume of gold and silver transferred between accounts of members:

* 'Gold prices' below are only paper gold prices (ETF contracts and options, except otherwise indicated). Since the gold market (rigged) event 04/15/2013, (small) buyers&sellers of physical metal in western markets are using different prices with much higher premiums than before (chart below).

Kitco spot price and Physical gold Premiums in western gold market; updated weekly
* Gold price in euros, long term :

* Global gold demand (source: Sharelynx) :


* Global gold demand (source: Sharelynx) :

World gold production growth exceeded population growth from the 1840s to 1940s

Global cumulative gold deficit, 1950-2012


Gold demand vs supply, 2013 Q1 breakdown by main zones
Source, 05/16/2013
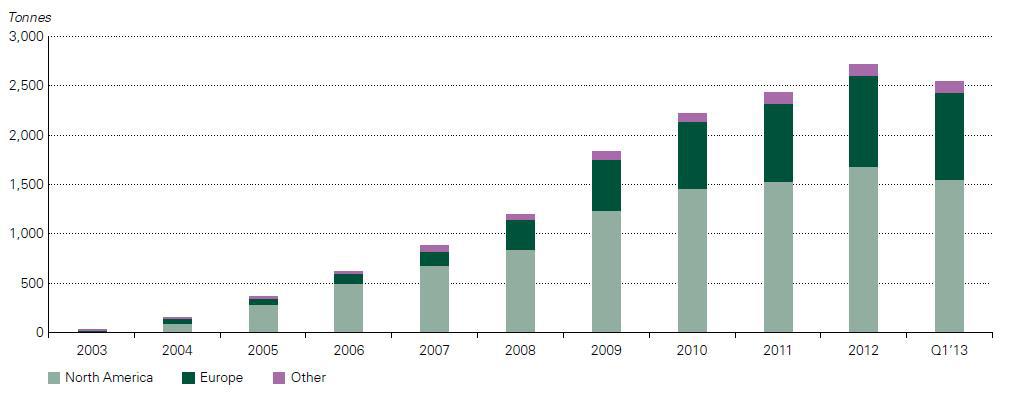
ETF gold holdings in tonnes by region, data series between 2000 and Q1 2013


Inflation Ajusted Annual Average Gold Prices, Official prices of gold (US, UK) and purchasing power for gold


Gold real price, 1344-1998 (in 1998$)
Source: sharelynx.com

Gold/silver ratio, data series between 1344 and 2012; source


Data serie since 1968, updated monthly


The English experience: indexes of the Price of Gold, Commodities, and Purchasing Power, 1560-1976 (1930=100)

The American experience: indexes of the Price of Gold, Commodities, and Purchasing Power, 1800-1976 (1930=100); source

Debasement of the Roman silver currency, year 1-269
(grams of silver per denarius i.e. the basic silver coin)
 source
(grams of silver per denarius i.e. the basic silver coin)
10-Year Gold Spot Price (U.S. $/oz) and Kitco Gold Index
2-Year Gold Price (U.S. $/oz)

2-Year Gold Price (GBP/oz)

2-Year Gold Price (Yuan/oz)

2-Year Gold Price (CHF/oz)

2-Year Gold Price (Euro/oz)

2-Year Gold Price (JPY/oz)

2-Year Gold Price (RUB/oz)

2-Year Gold Price (INR/oz)

2-Year Gold Price (BRL/oz)

2-Year Gold Price (ZAR/oz)

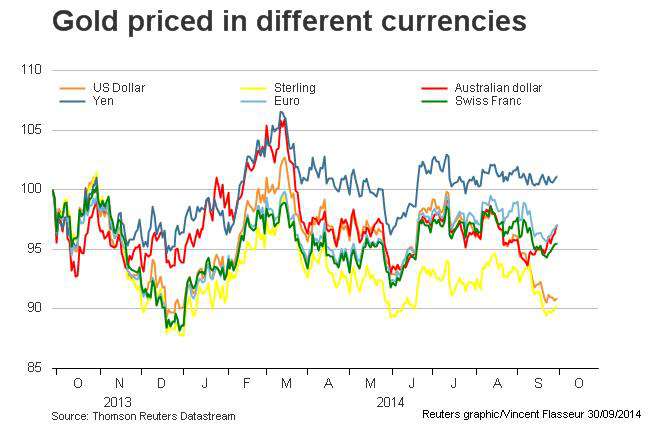
Gold price indexes comparison for some currencies

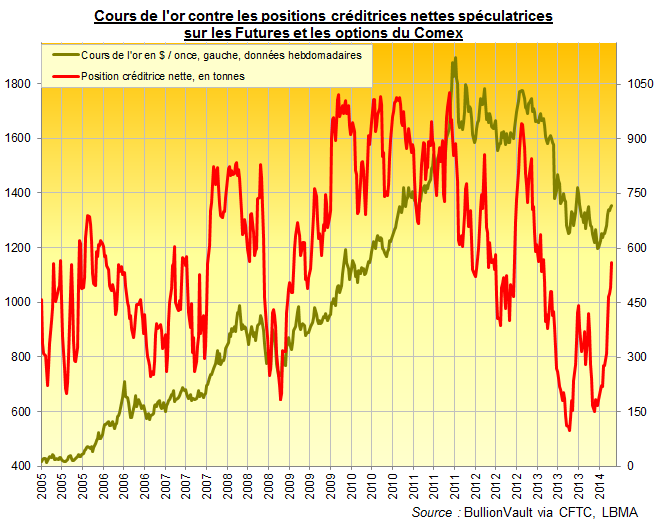
COT trading COMEX Gold futures

updated weekly with 3w lag; Source: SoftwareNorth

Source: Sharelynx; data serie till 10/2013
- GLD SPDR stockpiles : daily report (rhs); On 1/7/2014 this amount was 794.62 t.

GLD and Comex total Stockpiles (tonnes) between 12/1999 and 07/2013; source

GLD and Comex Stockpiles (tonnes) between 01/2009 and 12/06/2013; source

GLD Stockpiles (tonnes) between 05/2007 and 11/20/2012;
- 2013 Gold deliveries from GLD : see below in the Comex section
- ETF shares prices, updated daily :
IAU ETF: Data serie since 2005
PHYS ETF: Data serie since 2010
Central Fund of Canada CEF ETF: data serie since 2003
Zurich SGOL ETF: data serie since 2009
GDX ETF: data serie since 2006
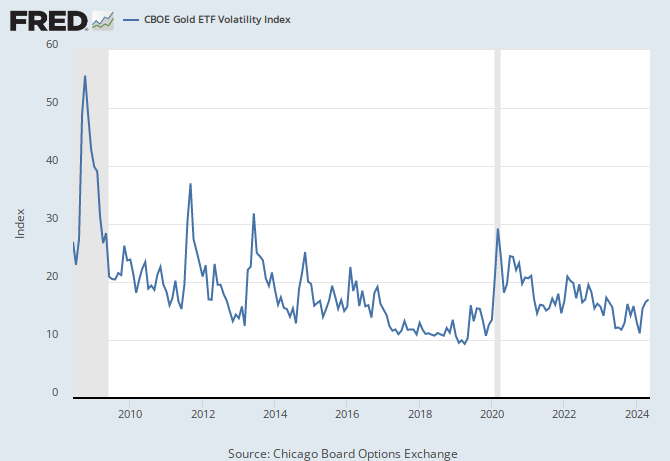
CBOE Gold ETF Volatility Index ; data serie since 2008/06, daily updated

AMEX Gold Bugs Index ^HUI ; data serie since 1996

Source: Sharelynx; Gold Funds index between 1986 and 10/2013
- Differences between gold ETF and gold futures contracts, in particular about the physical delivery of gold (100 troy oz for futures vs 10,000 troy oz)
Zoom on COMEX
- Globex or open outcry venue:
- Live Gold Futures prices, electronic session, updated every 10 mn
- or here till 2022
- or intraday charts here with 30 mn tick
- CME Group Globex gold futures ; updated daily ; For Globex, the Price column displays the price at which the transaction occurred. Some prices are followed by an "A" after the price indicating an offer or ask price which occurred at or below the previous last. A "B" after the price indicates a bid which occurred at or above the previous last.
- COMEX pit session futures quotes
- Comex gold GC1 futures contract :

- Monthly Bank Participation Reports include COMEX gold futures positions. You must read this analysis from Tud Ferguson about JPM Net Short to Net LONG huge number of futures.


- COMEX open interest positions and volumes :


About COMEX gold stocks:
- First, take notice of the disclaimer added since the first days of June 2013 about CME reported gold and silver stocks (see below). Turd Ferguson has a very good article about very highly dubious records (official explanations are "an insult to the reason"). Read the charts accordingly.
- Comex gold stockpiles (see below 24hgold updated charts) :
Comex total gold stockpiles (registered+eligible); Source; data series between 12/1974 and 1/7/2014
source (only the registered gold is relevant)


Comex registered gold; source; data series up to 9/11/2015

Comex registered gold; source; data series up to 9/15/2015


Source ; data up to 9/11/2015


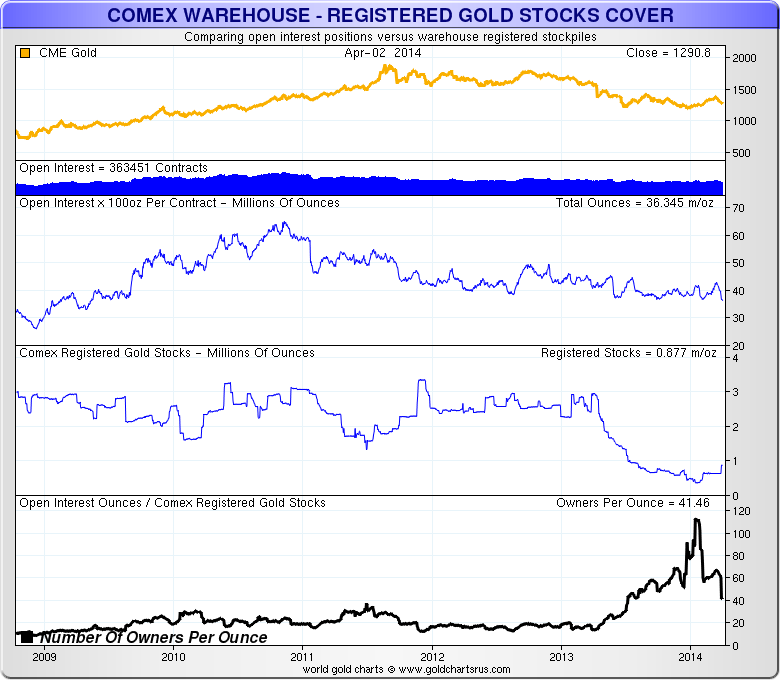
Comex registered gold cover ratio; source; data series up to 9/15/2015


source, 10/21/2013

JPMorgan registered gold at Comex; source; data series up to 9/11/2015

JPMorgan Comex registered and eligible stocks of gold during 2013; source

JPMorgan Comex registered gold; source; data series up to 9/15/2015

COMEX and GLD gold deliveries and inventories 2013, per month (tonnes); source
- See also these 5Y interactive charts for registered, eligible, and total gold; updated daily by 24hgold
- Comex vaults gold delivery notices and stocks: daily, MTD, YTD statistics (pdf)
- Comex vault depository daily statistics (xls, report of activity observed 2 trading days before from bullion banks JPMorgan / Scotia Mocatta / Brink's / MANFRA, TORDELLA & BROOKES / HSBC regarding registered and eligible gold stockpiles); same file here. Since June 2013, the following disclaimer has been added in these files :
- The information in this report is taken from sources believed to be reliable; however, the Commodity Exchange, Inc. disclaims all liability whatsoever with regard to its accuracy or completeness. This report is produced for information purposes only.
- For a particular refinery to deliver metal onto the commodities exchange, it must be a registered acceptable brand, such as Heraeus, Johnson Matthey or Metalor Technologies to name a few.Once these gold bars are produced, the metal must then be transported to the warehouse by exchange-approved carriers such as Brinks Inc., Via Mat International or IBI Armored Inc. There is no other way for the gold to get onto the exchange. Gold may move between Comex-approved warehouses, such as those operated by HSBC Bank, Brinks Inc., and Scotia Mocatta Depository. But any moves made between these warehouses must be made using the same approved carriers. No gold can enter the marketplace from outside of this refining loop.Once gold is removed from an exchange-approved warehouse and held somewhere outside of this circle of integrity, there is no way for the CME exchange to guarantee the bar's quality. This means that once a person or investor removes bars from the warehouse, then to return them to the exchange they would need to start at the beginning again. By going through the hands of the gold processor and refiners, this provides guarantee of the standard and quality of the material being delivered on the exchange.So with the gold inside the warehouse, second question: When is the gold considered eligible or registered on the commodities exchange?Answer: When acceptable bars are brought into an exchange-approved warehouse they become "eligible" for settlement of gold futures contracts traded on the exchange. So at this point, the owner of the bars may deliver them onto the exchange, and warehouse receipts are created. That is when the gold bars become "registered" stocks.Eligible gold stocks may or may not ever become registered stocks. Why? Because the warehouse is still a warehouse and the owner may simply want to vault their metal securely, before using it to meet demand elsewhere – for manufacturing, or from investors in another marketplace, such as Asia. This eligible gold may belong to an investor, a refiner, a hedge fund, a bank or producer. Many times these people are holding the metal for their end customers. And it may move at any time, and is much more flexible than the warehouse receipts that are registered stocks.The CME, the exchange, does not have any direct control over nor interest in the size of eligible stocks. Registered stocks however are officially recognized by the CME for good delivery on the exchange. That means that this inventory exists and is set aside to make delivery against gold futures contracts. Traders who stand for delivery, rather than cash payment, when their contract settles take delivery of the warehouse receipt. This does not change the quantity of registered stocks inside the warehouse. It remains registered, but the receipt changes ownership.If a gold futures buyer wants to take physical delivery of the gold and "break" the receipt then this is possible. But it is a process and takes time. Once broken, if the gold remains in the exchange circle of integrity – meaning the exchange-approved warehouse – then those bars become eligible stocks. But if the gold bars are removed from the exchange-approved warehouse then they no longer are eligible and are no longer tracked in any way.Third question then: How do the warehouse receipts work?A warehouse receipt is a bearer instrument much like a check. It can be endorsed from one party to another. The holder of the receipt pays the storage costs. Most times when people take delivery of a warehouse receipt they leave it with their brokers. In some cases people may want to take possession of the warehouse receipt themselves. This is rare, just like with equity or bond certificates; no one actually takes delivery of the documents any longer. But it is still possible for a fee.If a person owns a warehouse receipt, the gold that it represents is still in the registered stocks, even if they have taken physical delivery of the document. They can always redeliver these receipts onto the exchange by selling contracts. (source)
______________________________________________
- What happened in the Comex futures market since April 2013?


Largest U.S. bullion trading banks COMEX gold net short positioning, 2006 - 07/10/2013 (source)


Source, 04/25/2013


The sell orders of 4200 February 2014 Gold (GC) Futures on 1/6/2014 lasted 275 ms precisely; gold price went down 30$ and trading halted 10s (source)

GLD and gold futures drop of November 6, 2015; source

The Gold Money Index (or Fair Gold Price) is equal to the sum of Central Banks Foreign Exchange Reserves (reported in US $ equivalent) divided by the sum of Central Banks Gold Reserves (in troy ounces).

Fair Gold Price; data serie 1962-2012; note the log scale

Fair Value or International Monetary Value; Data serie 1960 - 6/30/2011
As of 6/30/2011, the actual price of gold was only 13.0% of its fair value.
The fair gold price obtained by us using the last available official data in July 2013 using the top 98 countries reporting the largest gold reserves (excluding IMF and BIS) is: 13,670 US $ / t oz; the actual price of gold as end of May 2013 was 10.2% of its fair value.
The top 98 central banks own 90% share of world central banks official reserves held in gold. Euroland countries' central banks own 34.5% share of world central banks reserves held in gold :
* Click for the list of the top 30 countries of the world sorted by their latest known foreign-exchange reserves excluding gold reserves
We can also calculate the value in mg of gold of all fiat currencies used in foreign exchange reserves = sum of mg of gold in top 98 central banks divided by the sum of foreign exchange reserves excluding gold.
We can also calculate the value in mg of gold of all fiat currencies used in foreign exchange reserves = sum of mg of gold in top 98 central banks divided by the sum of foreign exchange reserves excluding gold.
Basket composed by all fiat currencies used in foreign exchange reserves priced in gold, May 2013 : 2.53 mg per 1 share (1 share of the basket = 1 US$ equivalent).
The meaning here is that the central banks require for themselves to own gold reserves for sustaining international trade (i.e. for sustaining their foreign exchange reserves). The current amount of gold required, in the floating basket of currencies is 2.53 mg of gold per 1 share of the basket.
* Sum of Official Gold Reserves of Central Banks since 1845 :

in metric t of gold; data serie since 1885; source: WGC
Note: the used IMF data assumed US gold reserves to be 24 carats fine gold; the correct grade is 22 carats because this gold came from the melting of confiscated gold coins in 1933, and were stored without refinage. They were 22 carats gold coins. This gold is then easily traceable in the market because all other bullions in central banks are .995 or better grade (24 carats).


* East vs West :
Video of Mario Draghi: Gold is a reserve of safety for countries ; « L'or est une réserve de sécurité pour les banques centrales, c'est comme cela que le voit les pays »
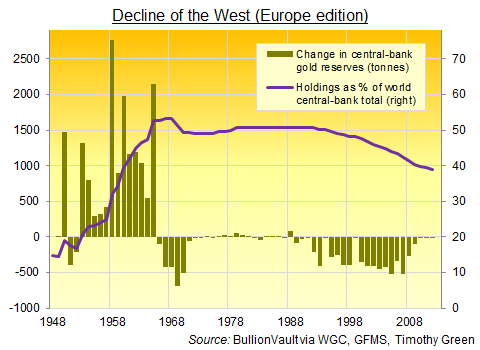


1a: Non-Western Central Banks (RoW) have been increasing their holdings of gold at a very rapid pace, going from 6,300 tonnes in Q1 2009 to more than 8,200 tonnes at the end of Q1 2013 (source)
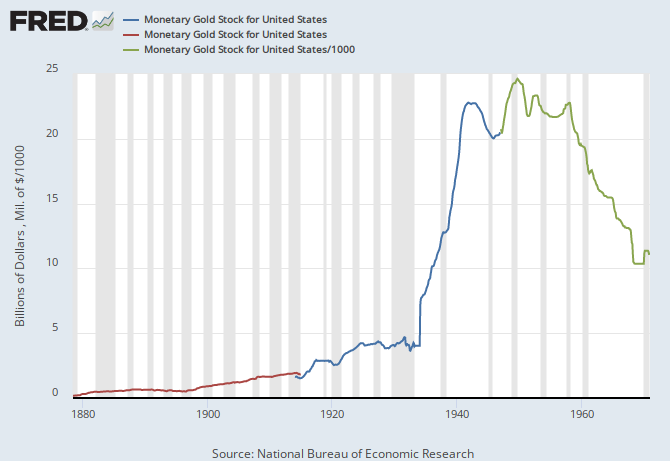
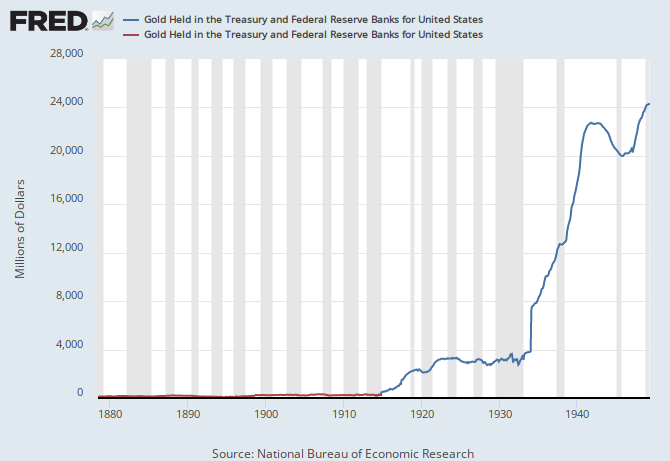
* U.S. :


source: goldchartsrus.com


* U.K. :

* gold leasing and CBGA :


Gold leased by central banks worldwide, 1980-2012 (source)

Above ground gold stocks

History shows this question has only one answer: gold markets are extremely centralized, and subject to opaque arbitrage by big players (Central Banks, bullion banks...) and market dominance in order to push down gold price when necessary. It is not a free market. Gold is always heading where the most influential policy makers are pushing... but not always in the direction they imagine they are pushing in, as we are seeing now because of new extreme market conditions (backwardation, deflation). Big players are loosing control day after day.
At the extreme, there will be no more gold market (not even a rigged market), because there won't be any more a centralized market. There will be only barter, the basic and original distributed form of market.
But there are two possible forms of end game: hyperinflation and hyperdeflation. Both are terrible, but the second is an even worse pain. The only action by the FED is to delay some time then only choose between this two paths when events will accelerate. If they do nothing more than today then hyperdeflation will occur... even if they wish for hyperinflation because they do not use the correct monetary theory! Even with an hyperQE they cannot change that.
But with destruction of production capacities inside US territory (confiscation, rebellion, mass riots...), we could see hyperinflation occur. Some people in the banking system could think they would have a much better chance with hyperinflation, because they would be the "first persons to be served". This is another illusion. The american people will destroy the FED in both cases.
[I first published this paragraph in July 2013, following years of public explanations and papers by A.Fekete and NASoE members. I can see since November 2013 a very noticeable transformation in the mind of many well known gold analysts, from hyperinflation to deflation trend. KWN hosts interviews archives with a lot of them.]
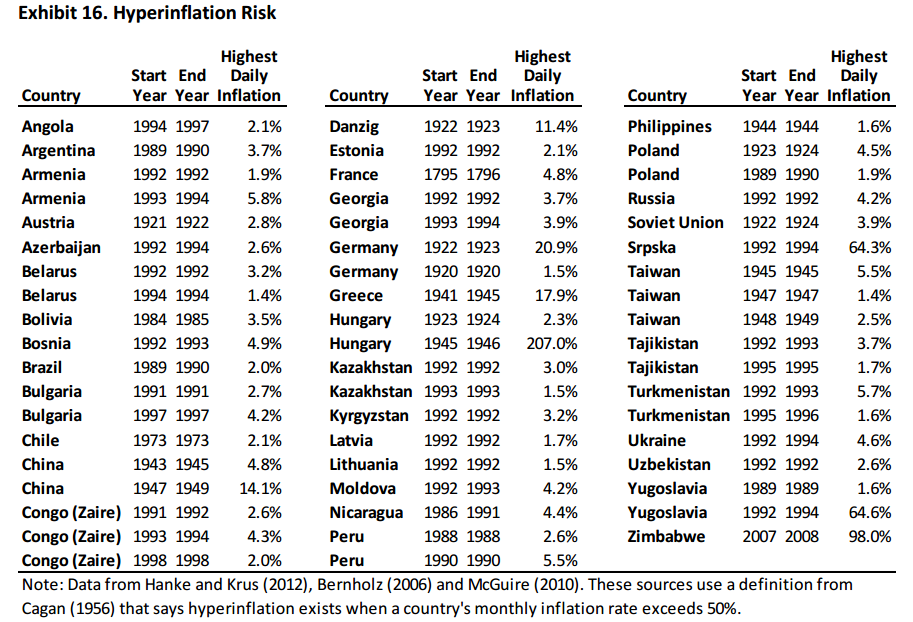
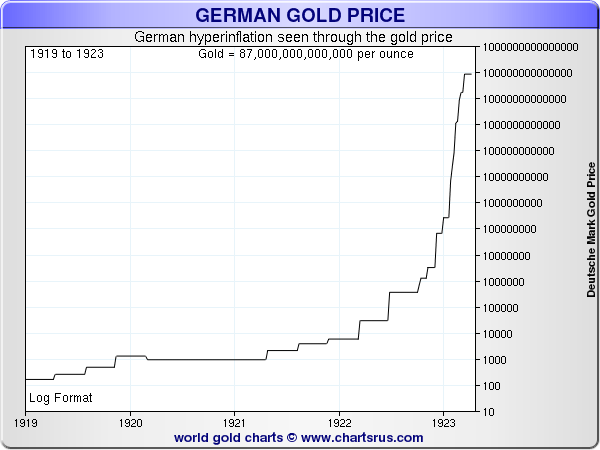
Where is the price of gold heading during hyperinflation ?

https://www.xerficanal.com/economie/emission/Olivier-Passet-La-deroute-des-theories-economiques-et-monetaires-dominantes_3747492.html
RépondreSupprimer