2012/02/26

New US Gov. Budget : public debt to GDP ratio will exceed 137% in 2016

[This is the part 3 of our series on US Debt : read part 1, part 2]

On February 13, 2012, the new FY2013 federal budget was released. It budgeted further major increases in the public debt each year up to 2016. We added these exact values to our open model we recently released and used to follow the trend of rising US public debt.

The US Gov. has made some assumptions about the future country GDP up to 2016, just to explain that the debt to GDB ratio will remain constant (or "under control" politically speaking). Our open model allows anybody to test with any other hypothesis.

Here are the main results for 6 scenarii : 
  • 1% growth per year  
  • 0% growth per year 
  • a scenario with required growth to meet the US Gov. debt to GDP goals each year. Yes you are right, US GDP needs to grow 7% in 2015 and 2016. 
  • 2% growth per year
  • and 2 different scenarii involving a systemic shock and a depression : one similar to 2008 crisis, and another one similar to the implosion of former USSR in 1990's.

Please note that none of these scenarii are taking into account an upcoming QE3 or any new massive bailout which will inflate the debt even faster (as US Gov. has always chosen this road). 
The first four scenarii are simple continuity of the past since 2009, if you're placing any confidence into these GDP figures :


Do you really think the third scenario, supported by the US Gov., is the most probable ? We don't think so. 
We therefore consider that the total public debt to GDP ratio will exceed 137% in 2016, and up to 250% when massive bailout, or worse, will surge again.

2012/02/23

La dette publique US suit-elle une croissance exponentielle ?

 Le 
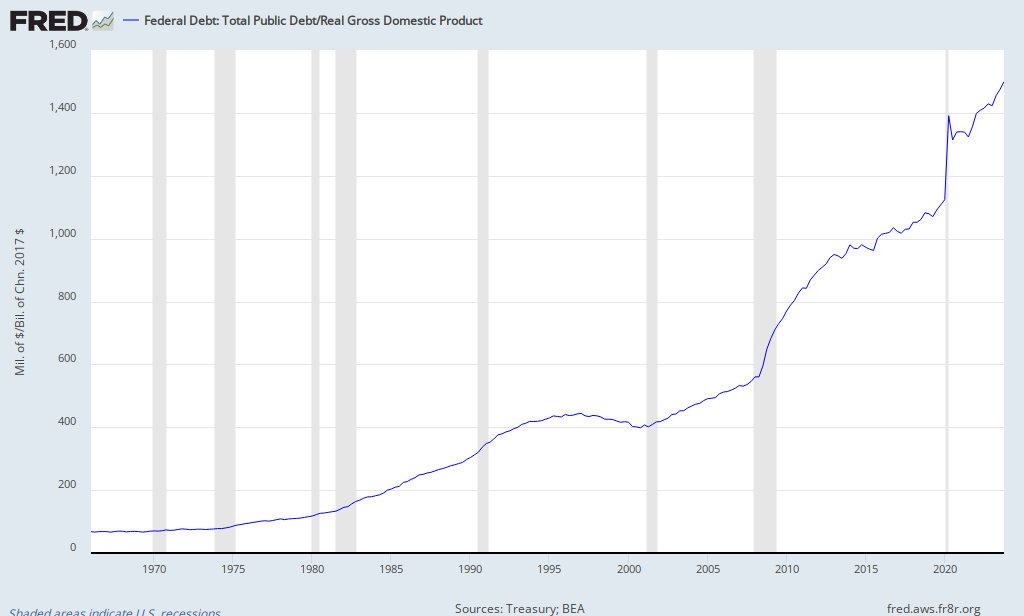
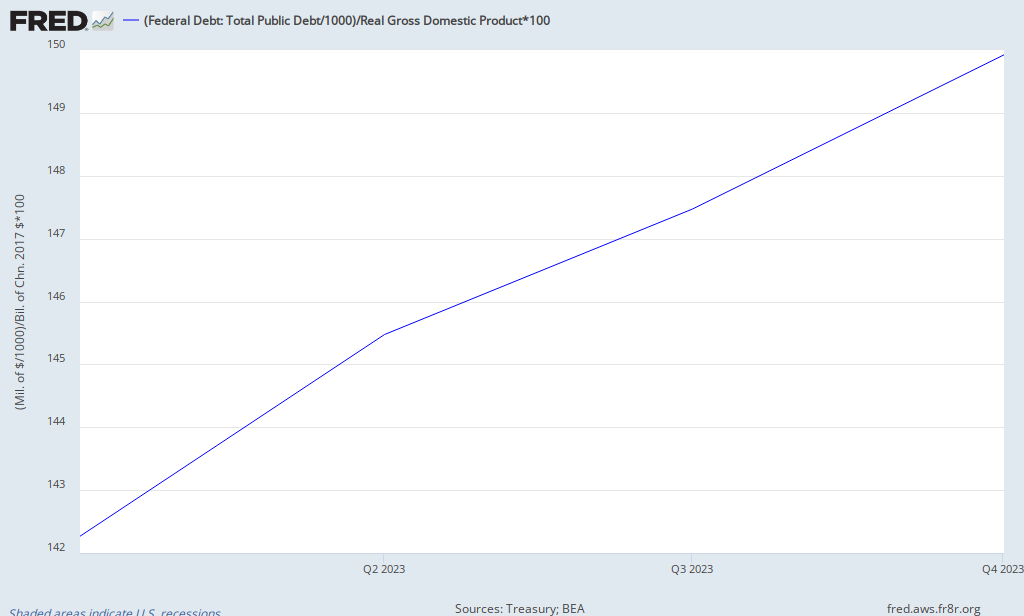
billet précédent se termine par la mention de la linéarité de la croissance du ratio de la dette publique US / PIB depuis 2009. Cela signifie qu'il est possible de connaitre la valeur de ce ratio à une date postérieure à 2009 en modélisant cet accroissement. On pense bien sur à une forme affine y=a*x+b, avec la valeur de l'accroissement mensuel que j'ai indiquée. 

J'ai ensuite voulu chercher si on pouvait modéliser l'accroissement par une suite géométrique discrète 
q(n) = q(0) * r^n 
où r est la raison de la suite, le point 0 est le 11 mars 2009 et n le nombre de jours depuis cette date.

Avec q(0) = 86.26 , un rapide calcul donne une valeur de r = 1.000274214
r > 1 indique une croissance exponentielle du ratio de la dette / PIB ; une hyperinflation de ce ratio en somme ! 

Bien sur r est très proche de 1, il est donc encore difficile de trancher définitivement entre forme affine ou forme exponentielle. Les valeurs des mois prochains nous en diront plus, ou bien les coefficients de régression linéaire... Ce qui est certain c'est que le service cumulé de la dette (c'est à dire emprunter toujours davantage pour pouvoir rembourser une dette précédente) forme bien une série géométrique.

Update 24/2/12 :
J'ai modélisé ce matin la variation de la dette entre octobre 2001 et le 15/09/2008, juste avant l'énorme pic. La durée est 2.5 fois plus longue que sur l'étude précédente.
En forme affine on obtient un accroissement mensuel de 0.2643 points, avec un coefficient de régression linéaire (Bravais-Pearson)  p = 0.995, soit p² = 0.990
Pas mal mais pas excellent comme corrélation statistique.
Signalons que ce coefficient de Pearson p = 0.99379 (p² = 0.9876) entre 2009 et 2012, d'où la difficulté de trancher que nous avions hier.

Mais maintenant, modélisée sous forme de série géométrique, on obtient entre 2001 et 2008 une raison r = 1.00014126

Encore une fois r > 1 ! Et on remarque que r a augmenté après le pic de fin 2008, ce qui prouve qu'on a changé de série, mais aussi que la dérive exponentielle de la dette s'est encore aggravée puisque r est devenu encore plus grand.

Si on simule maintenant tous les points des 2 séries géométriques à l'aide des 2 valeurs de raison, on peut ensuite calculer la corrélation entre ces points simulés et les valeurs de la dette publiées quotidiennement.
On obtient alors entre 2001 et 2008 une valeur du coefficient de Pearson p = 0.9944 (p² = 0.989)
et entre 2009 et 2012 une valeur du coefficient de Pearson p = 0.992 (p² = 0.983)

Dommage. Pour l'instant, les données recueillies ne sont pas encore assez nombreuses pour pouvoir trancher entre les 2 hypothèses de manière définitive.

En conclusion :
  • Nous disposons maintenant d'un outil simple, entièrement transparent, qui dépend de données publiées quotidiennement, et que tout un chacun peut utiliser pour auditer régulièrement ou même anticiper de manière quantitative les évolutions de la dette des US. 
  • Notre exercice nous autorise à dire qu'il n'est pas exclu de considérer que la croissance du ratio de la dette publique totale des US / PIB soit exponentielle, avec l'effet auto-accélérateur foudroyant qui accompagne obligatoirement cette dérive à partir d'un certain point que l'on peut apprécier mathématiquement. On peut même dire que l'on pourrait mesurer la longueur restante de la mèche.
  • Dans les 2 cas, mais encore plus particulièrement si la dérive exponentielle s'impose, cette dérive met aussi en lumière deux impossibilités absolues : d'une part qu'il est impossible pour les US de se sortir de la dette par davantage de dette ; d'autre part qu'ils ont démontré jusqu'à présent qu'ils étaient dans l'incapacité de réagir différemment par rapport à leurs problèmes gravissimes de politique économique.
  • Enfin, que dans une telle situation de banqueroute annoncée d'un pays, il n'y a pas de meilleur conseil à donner que d'en parler de manière transparente à ses créanciers et partenaires internationaux, et d'accepter rapidement leurs propositions. En l'espèce, il ne peut s'agir que du G20 et de commencer par la remise en cause complète du rôle du dollar dans les échanges internationaux, la refonte des participations au FMI, à la BRI et au conseil de sécurité de l'ONU. C'est cette prise de conscience de la part des autorités US et de leurs cercles d'influence qu'il faut encourager, car c'est l'étape la plus longue et la plus difficile. La communauté internationale s'y essaie depuis 2008, sans aucun succès jusqu'à présent. Pourtant, une sortie de crise d'une telle ampleur historique, ca demande de s'y atteler dès maintenant pour absorber et étaler au mieux l'onde de choc. Dans l'autre scénario de l'absence de prises de responsabilité de la part des US, elle se produira aussi mais de manière dévastatrice, et en premier lieu pour les américains eux-mêmes, comme l'Histoire nous l'enseigne, hélas. 


US public debt to GDP ratio is 115 % !

 If you take the total public debt outstanding  (daily published) and the annual or quaterly GDP in chained 2005 dollar (bea.gov), the current ratio is not 101% as reported by ZeroHedge but 115% ! And the observed trend is linear since 2009 : the ratio increases by +0.82% each month, much higher than the slope before 09/2008. This is a clear sign of an economy under massive perfusion by debt monetization.
Who said it's a zombie economy ?

I have analyzed the mathematical trend of these data in another article.
Update 05/25: You can find a longer data serie directly on FRED :

data serie since 1966, in % of GDP, chained 2005 dollar; updated quarterly

Update 10/05 : I add below an extract from the dedicated page about US Debt.

1Year data serie, in % of GDP, chained 2005 dollar; updated quarterly

You read it correctly : figure for 2012Q3 is nearly 118 % (and growing) !!


2012/02/22

US challenges (summary)

 The European Centre for International Political Economy has recently released a paper about China's challenges. I disagree with most of its content, and even more with what is not mentioned about US when the author is comparing both countries. I then noticed that little changes like swaping China with US in the text, adding new links, will reveal much of the other side of the story. Here is the resulting new text.


SUMMARY :
The global economic crisis has changed the perception that many countries shared on US. It is no longer viewed as a financial paymaster, but rather an unruly and disruptive potential pupil. Hence the aim of this paper is to identify and describe the challenges that US is facing in its new role. This paper argues that American developments in all three areas are imposing increasing strains on the country’s political system and institutions and demand new approaches both inside and outside the country. The future for the country is still uncertain due to many vulnerabilities in economic, domestic and foreign policy.

Economists forecast that China’s GDP is to exceed that of the US within a decade or two. Although these predictions may get little attention among investors, it is also worth remembering that they are based on simple extrapolations of the past. Yet, challenges such as the confirmed obsolescence of growth model, the growing pressure of unemployment, and the lack of diversification lie ahead for US. These challenges need to be faced by a new government and policy that will balance the fiscal situation and put US back on track for fast economic growth. Besides, domestic policies face the challenge of rapid escalation of social unrest among US’s population. The increasing number of ‘mass incidents’ (and Occupy Movement) across US, the huge number of people who have access to the Internet and the free exchange of information via ‘micro-blogs’ and tweeting networks, on which 240 million American netizens (as Internet users are known) express their grievances represent a threat to the existing system. Although the traditional bi-Party still commands big respect among richer citizens the level of corruption is alarming and has started to bother younger and poorer generations. And yet, the rulers in US are still a long way from formulating a coherent response to the demands of an increasingly impatient public.

As is the case for its domestic policy, US’s foreign relations are rooted in one fundamental imperative: keeping its regime in power. The government is ready to do whatever is necessary to maintain bloodless growth by keeping financial markets under perfusion, securing access to energy and natural resources worldwide and preventing the economy from being blown off course by external shock. Since Washington has few military allies its international influence is exercised largely through the medium of money and the language of brute force. However, the huge dependency on the global economy will sooner or later become too important for US to remain on the diplomatic sidelines.

There is growing evidence of broadbased popular demand for democracy (Wikileaks, Anonymous, growing debate to end bi-partism or to reform the US constitution), and the pressure for change is increasing. The government’s legitimacy – based on performance – is coming under strain from several directions and these challenges, which are both economic and political, need to be addressed. However, US’s bi-Party system has not yet formulated a clear, effective response strategy. For the rest of the world, the only realistic option is to continue trying to engage US pragmatically but without conceding on essential principles : the usual rules from the XXth century are broken, the dollar cannot remain the global trade currency, whatever the US’s military dominance currently. We are entering a new era, a post-US dollar world, and to remain peg with the dollar will doom your own currency as well.

2012/02/05

Global supply and demand trend to its lowest since 27 years (Baltic Dry Index)

 We are following the Baltic Dry Index since 2008. This composite index gives insight in global supply and demand trends. The small picture to the left is a 1 year chart updated weekly.
Financial News has recently published a report about its trend since 1 year.

But the situation is even worse : the Baltic Dry Index has reached this week its lowest since 1985 (the year this index was first published) at 647 points, even lower than the previous low at 663 points in december 2008, or in december 2001.

(clic to enlarge the picture)

Handy Shipping Guide has published this week an in-depth article about this multi-decades record low as well as Bloomberg (when the index was at 662 points, its lowest since 1986 - now the index has reached even lower to 647), and businessweek.