You can click on each chart for a better rendering and zooming.
..: Updated weekly :..
______________________________
Debt and Economic Dashboard of Japan
charts and data series
1. Main Aggregates for Japan Debt
Japan Total, Government and Private Debt (% GDP)

General gov. gross debt as % of GDP (blue, lhs); General gov. gross debt in Yen tn. (red, rhs); Data serie since 1980; updated yearly
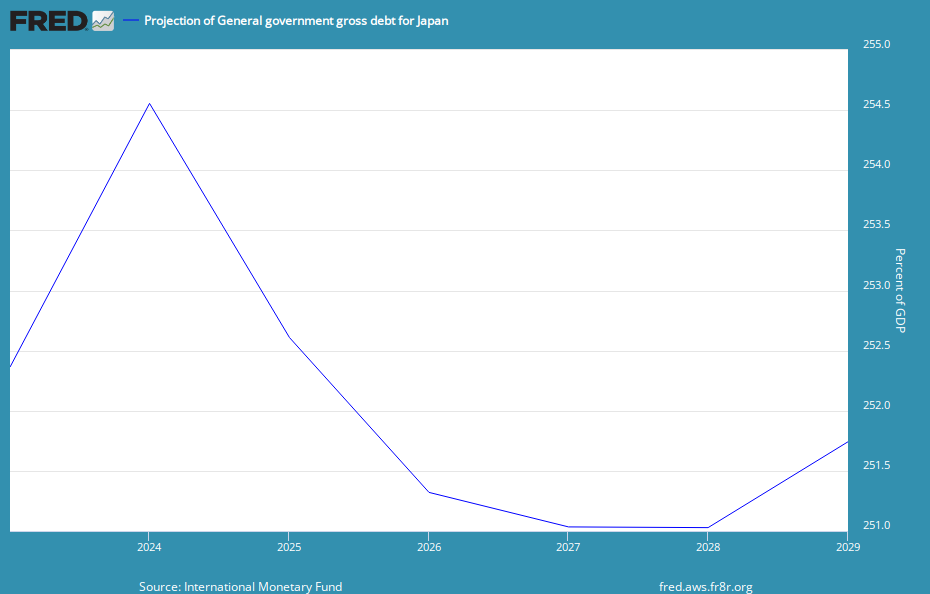
Official projection of general government gross debt (% GDP), till 2018; updated yearly

Gov. debt (% GDP) is lower than gov. gross debt above;
Data serie 1885-2010 (note: axis labels are erroneous); source
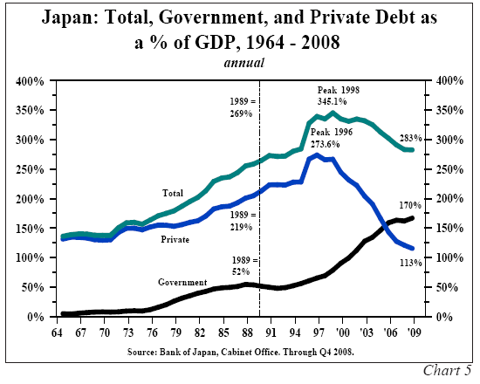
Gov. debt (% GDP) is lower than gov. gross debt above;
Data serie 1964-2008; source
Debt to GDP ratio: comparison of selected countries
Japan: Debt maturity

Source: CQCAbusinessresearch.com, April 2011
(before the new QE program of BoJ)
(before the new QE program of BoJ)
Japan: Debt by sector

Data serie 1980-2009

Data serie 1980-2007

Data serie 1980-2007
- Comparison with the U.S. :

Data serie 1974-2009
Japan: gov. debt per worker

Data serie 1993-2011
Japan: gross gov. debt
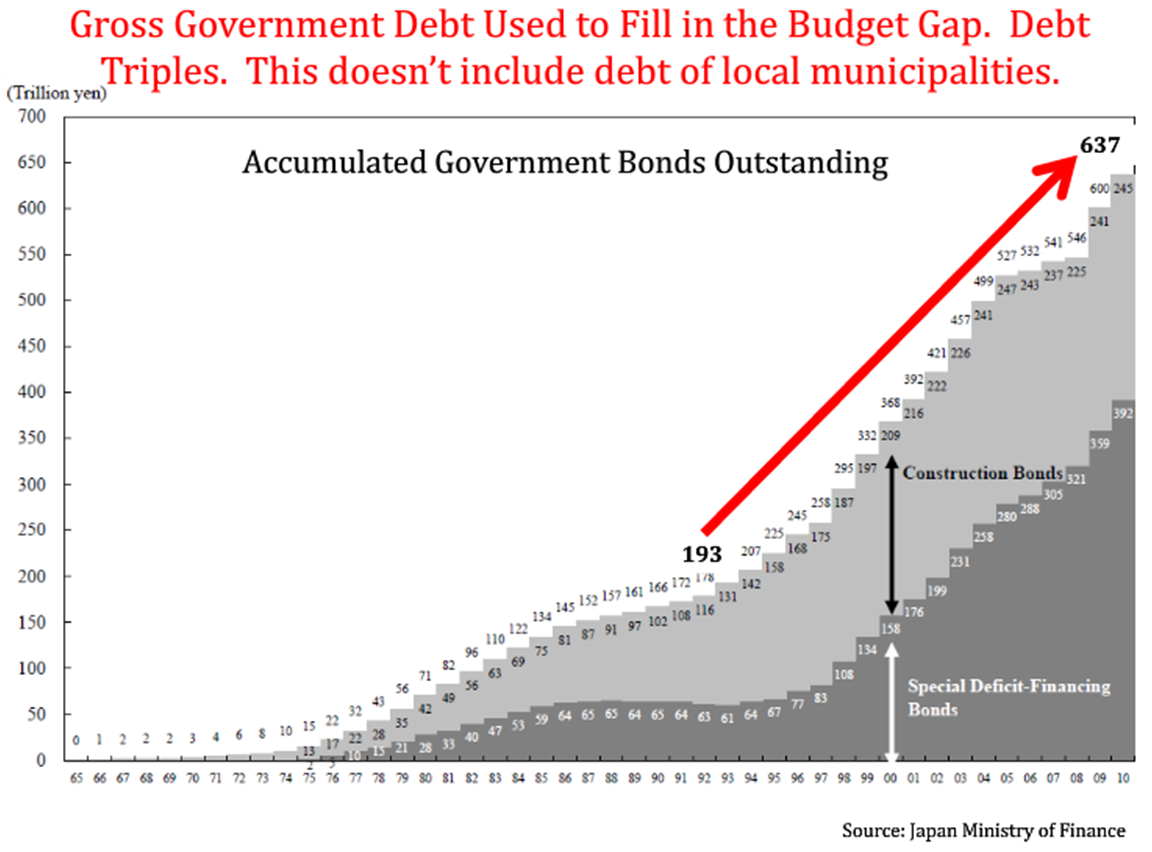
Data serie 1965-2010
Japan and G10: Debt distribution (% GDP)

Source, nov. 2011
Japan: combined central and local gov. debt (% GDP)

Data serie 1980-2025 with estimates after 2011
2. Japan Debt Service and Budget
Japan: Debt service (% tax revenues)
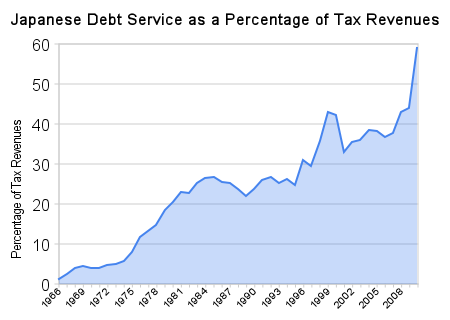
Data serie 1966-2010
Japan: Interest payments, rate, gov. debt amount

Data serie 1975-2011
Japan: gov. budget deficit (% GDP)

Data serie since 1960
Japan: gov. external debt

Data serie since 2002

Data serie since 1994
Japan: gov. expenditures

Data serie 1965-2009
Japan: spending and tax revenue

Data serie 1975-2009

Source; data serie 1975-2011

Source; data serie 1975-2010
Japan: balance of payments and current account balance
- see on Bloomberg the 1Y moving data serie

Data serie 2000-2007
Japan Debt and deficits compared with selected countries, 2012

3. Japan monetary policy and holding of government bonds
Abenomics : QE ad nauseam

BoJ monetary base 2000-2014; Source
BoJ rate
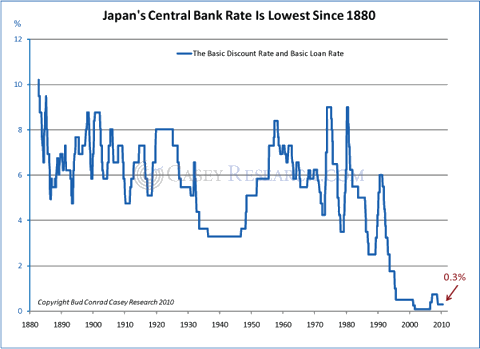
Data serie 1880-2010

Data serie since 1972; updated monthly
BoJ: monetary aggregates M0, M1, M2, M3

M0: Data serie since 1967; Updated monthly

Data series since 1955; Updated monthly

M3, total credit, monetary base, and Nikkei index YoY change rates;
Data serie since 1990; updated monthly
- Current account balance : BOJ data.
Velocity of M2 Money Stock

Data series since 1959 and 1994; updated yearly and quarterly
It is calculated as the ratio of nominal GDP to the M2 money stock.
Japan 10Y Treasury yields and gov. debt to GDP


Japanese Gov. bond yield (blue), Japanese Treasury Bills yield (red), and Spread (green); Data serie since 1967; Updated monthly


Japan: holding of gov. debt

The holdings of JGBs by Japan’s banks equate to 900 % of their tier one capital, compared with about 25 % for UK banks’ exposure to gilts and 100 % for US banks’ exposure to US Treasuries.
More than 90 % of JGB are held by japan domestic institutions.
Source, data published 12/2012.
The BoJ held Y105 tn of government bonds at the end of September 2012, or 11.1 % of the total. Overall, Japan’s government debt climbed 3 % compared with a year earlier to Y948 tn.
Japan: holding of gov. bonds by foreign investors

Data serie 2003-2011
Foreign Japanese government bond (JGB) holdings were up 11 % at the end of September 2012 compared with a year earlier. Both the amount and the share of the total, which rose 0.4 percentage points to 9.1 %, were records.
At the end of 2011, 45 % of U.S. Treasury bonds were owned by foreigners, while the comparable figure for U.K. Gilts was 32 % (Source), and more than 70% of the Australian Commonwealth bond market is in foreign hands (source, 06/2013).

Japan: foreign exchange reserves

Data serie since 1957; updated monthly
Japan Yen / US Dollar exchange rate and Nikkei 225
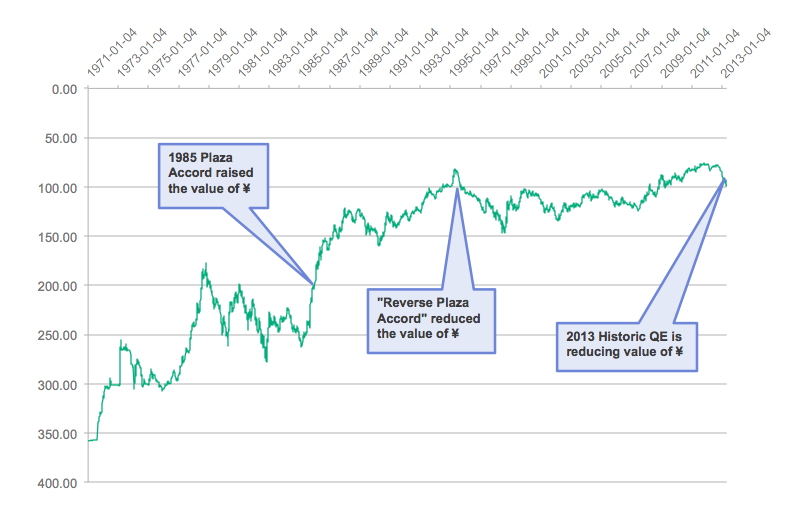
Data serie 1971 - 01/2013

Data serie since 1996; updated daily

Comparison of Nikkei 225, Dow, Nasdaq, S&P500 evolutions for 6 months; updated daily
Japan: income growth components

Data serie 2000-2007
Japan: outward and inward direct investment

Data serie 1985-2007
Japan: gross national savings and household gross saving rate
Data serie 1980-2008
Japan: household investment

Japan: Annual savings and savings rate

Data serie 1980-2007
Japan: population and property prices


Population growth YoY; Data serie 1950-2010
Japan: employed persons

Data serie since 1954; updated monthly
Japan: annual hours worked per employed person
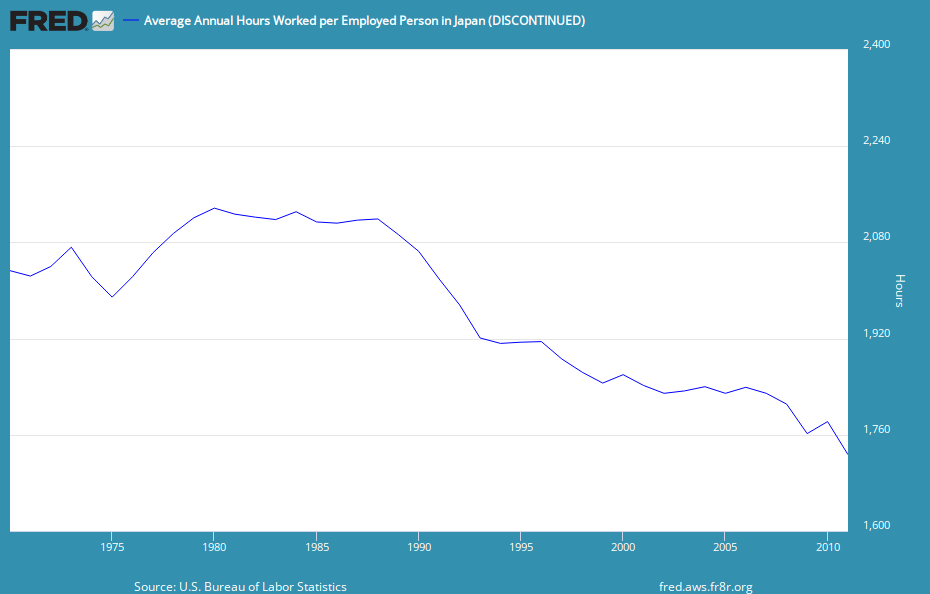
Data serie since 1970; discontinued
Japan: labor force participation rate

Data serie since 1970; discontinued
Japan: consumer price index (general) and inflation rate

Data serie since 1970; discontinued

Data serie since 1958
Japan: consumer price index (housing) and Japan housing index

Data serie since 1970, updated yearly

Data serie since 1960
Japan: production of total industry and capacity utilization

Data serie since 1956, updated monthly

Data serie since 1968
Japan: business confidence

Data serie since 1983
Japan: consumer spending

Data serie since 1994


Aucun commentaire:
Enregistrer un commentaire