2012/09/13

The 9/11 attacks in historical perspective

On September 8, 2012 President Obama marks the eleventh anniversary of the September 11th with asserting that America’s questions about 9/11 have been answered.
Still, the unanswered questions of 9/11 are numerous and of critical importance. As a keystone, the whole U.S. society needs to know the truth about 9/11. 

In memory of the U.S. democratic Republic, I publish today a compilation of historical facts and famous texts over one century, with a focus on the last 11 years. We must remember that each path is a sum of steps.
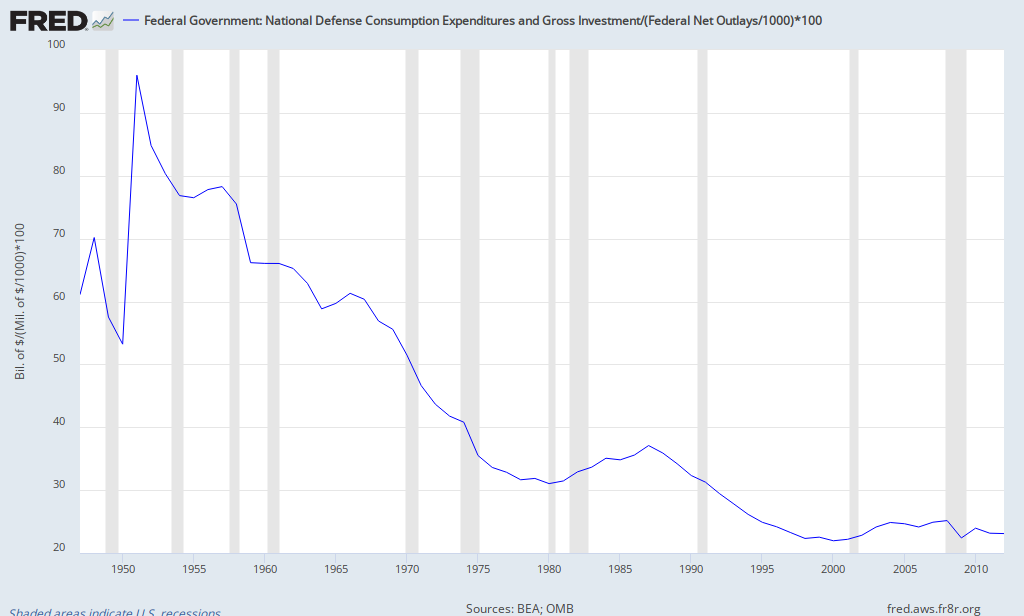
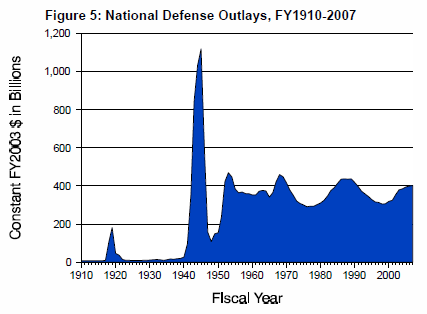
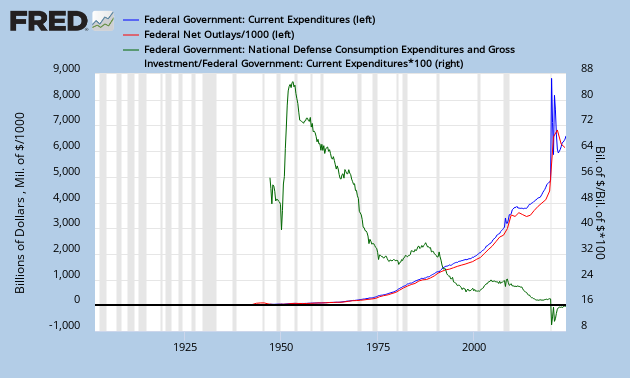
I also used the term "deep state capitalism" in reference to Pr. Peter Dale Scott's books about deep politics.

'The U.S. in 20th/21st century, Part 2' will be published in the next few weeks, including a political anticipation about the US.
(04/02/2013: done, see the update below!)

Update 09/19/2012 :
I love the "release soon, release often" principle. To publish an early draft allowed me to bring my attention on P.D. Scott's last books, and I found that my small contribution is like a very short summary of his "Road to 9/11: Wealth, Empire, and the Future of America" published in 2007, sharing the exact same spirit up to the choice of words in titles :)
My contribution is complementary, covering military budgets and events since 2007 or during the first part of XXth century, and is free, but I strongly recommend to buy his book for much much more details about  historical and political facts and references since the 60's.

Update 02/25/2013 :
Even closer in the transdisciplinary approach I'm using, my small compilation is also a relevant introduction to Chalmers Johnson's prominent "Blowback" trilogy, and specially the last volume: Nemesis - The last days of the American Republic. Do not miss it !

Update 04/02/2013 :
'The U.S. in 20th/21st century, Part 2' has been published in the Magazine of Political Anticipation in français, deutsch, english, español

2012/09/08

The growing role of gold in the evolving international financial architecture


Let's start with a relevant extract from the last WGC report :
"The second quarter was another period of significant purchasing by official sector institutions, with demand amounting to 157.5 tonnes.This was a record quarter for central bank buying since the sector began recording net purchases in Q2 2009 and was more than double the 66.2 tonnes of purchases made in the same period of 2011. 
Purchases in the first half of the year totalled 254.2 tonnes, 25% up on 203.2 tonnes from the same period last year. The official sector accounted for 16% of overall Q2 gold demand.
Some central banks have clearly indicated their intention to bolster gold reserves. One such institution is the National Bank of Kazakhstan, which stated in July that it had increased its 2012 target for gold purchases from 24.5 tonnes to 26 tonnes. 
The bank has previously stated that it plans to buy the country’s entire domestic production over the next two to three years in order to reduce its reliance on the US dollar as a reserve assetconfirming that it is targeting an allocation to gold of 15% of its foreign exchange reserves.
Following the confirmation in June that it had purchased over 32 tonnes of gold in March, the central bank of the Philippines made no net changes to its reserves throughout the second quarter. The bank’s stated policy of buying local mine production remains in place and reserves as at the end of June stood at a provisional 194.2 tonnes, equal to around 13% of total reserves. 
Russia’s programme of buying saw the central bank add a further 22.3 tonnes to its reserves during the April to June period. Total gold reserves at the end of the period stood at around 920 tonnes, roughly equal to 9% of total reserves. 
The National Bank of Ukraine appears to have accelerated a programme of very small sporadic purchases, which it has made over recent years, with four consecutive monthly additions to its gold reserves since March of this year. These transactions have been small in size, with purchases in the second quarter totalling 3.6 tonnes, but relative to total holdings of 32.8 tonnes this represents a significant percentage increase in the bank’s gold reserves.
Small purchases were also made by a range of central banks across Europe and South America, including Serbia (+0.2 tonnes), Guatemala (+0.2 tonnes) and the Kyrgyz Republic (+0.2 tonnes).
Turkey continued to record increases in its gold reserves; however, these additions are excluded from our data. As reported in the previous issue of Gold Demand Trends, recent legislation allows commercial banks to pledge gold as part of their reserve requirements to the central bank. The reported changes in Turkey’s gold reserves reflect changes in gold pledged by commercial banks, rather than acquisitions by the central bank in the open market. While not representing a traditional addition to official sector reserves, the increase in reserves reflects the growing role of gold in the evolving international financial architecture.
Following a similar pattern to its actions last year, South Korea’s central bank announced in August that it had purchased 16 tonnes of gold in July, having “judged ...market conditions were good” to make a purchase as part of its stated ongoing diversification of reserves. Coming as it did after the end of the quarter, the purchase is not captured within the second quarter data but is confirmation of a continued trend of purchasing by the sector. The bank has increased its gold holdings by 56 tonnes since June last year, with the aim of diversifying its portfolio. The latest purchase takes South Korea’s gold reserves to 70.4 tonnes, accounting for around 1% of total reserves. 
Sales among central banks remained muted in the second quarter. Under the terms of the third Central Bank Gold Agreement, sales [...] amount to just 13.9 tonnes."
The gold buying policy of Russia Central Bank is not new. But in just 4 years of global systemic crisis, ALL central banks have switched the diversification policy of their reserves, as depicted below :


Except Switzerland, the bar and coins demand market has increased in Europe since last quarter. It is now the biggest market in the world, above China or India. 

Source : WGC Gold Demand Trend Q2 2012 report

2012/09/07

Conséquences sur Internet de la fragmentation géopolitique mondiale

 Le nouveau terrain géostratégique représenté par le cyberespace est de plus en plus souvent débattu. Nous avons déjà évoqué le sujet (voir par exemple le MAP numéro 2), au travers de la cyber guerre. Mais ces analyses ignorent les possibles conséquences à terme de la dislocation géopolitique mondiale sur le réseau des réseaux, alors que c'est un point que j'étais le premier à souligner dès octobre 2008.

Voici une brève de LMI que je reprends pour mettre en lumière la dimension de la nouvelle tendance à la fragmentation d'Internet

"Les États-Unis ont clairement indiqué aux Nations Unies, et à son agence UIT, qu'ils n'avaient pas l'intention d'abandonner le contrôle de l'Internet.[...] la Russie a l'intention de demander à ce que l'UIT soit chargée de l'attribution des adresses IP et de « la détermination des conditions requises ». La proposition russe devrait être soutenue par plusieurs autres pays, dont la Chine."
Cette brève fait suite à la récente fuite du texte de la délégation U.S. pour la conférence WCIT en décembre prochain.
On est incité à croire que le Réseau a aboli les frontières... pour toujours. C'est faux. Il les a momentanément affaiblies, au mieux. Dans cette dynamique de long terme, un nouvel essor des frontières au sein du Réseau nous semble inévitablement lié à la perte continue d'influence des U.S. et à la montée des enjeux du contrôle souverain de chaque bloc régional.

Mise à jour 9/09/12 : 
lire l'article de CNET.com publié en mai dernier.

Mise à jour 5/12/12 :
Article de Computer Weekly, publié ce jour.

Mise à jour 12/12/12 :
Article de LMI, publié hier.

Mise à jour 17/9/13 : Anticipation définitivement confirmée.
  • The BRICS “Independent Internet” Cable. In Defiance of the “US-Centric Internet”: Article de GlobalResearch, publié aujourd'hui.
  • Brazil plans to go offline from US-centric internet : TheHindu.com
  • Brazil Looks To Break From US-centric Internet : ExcitingRio.com
Mise à jour 7/10/13 :
  • BRICS cable eyes 2015 completion, BRICScable.com, 03/2013
  • BRICS Submarine Cable Planned to Connect South Africa with Brazil, India, China, US and Russia : IHS.com, 04/2012
  • Ce cable ne doit pas être confondu avec le cable South Atlantic Express (SAex) annoncé auparavant (Brics nations back R 3bn Brazil-SA mega cable, techcentral.co.za, 04/2011)

2012/08/01

Les devoirs de vacances de la zone Euro

 Le concept de "brouillard de guerre" s'est décliné en géostratégie "soft power" par la guerre de l'information ou infowar depuis 50 ans. Malgré les déclarations  depuis fin 2009 dans les médias sur la crise de l'euro, la guerre monétaire contre l'Euro (car ca en est bien une) se joue principalement en coulisses, dans les espaces spécialisés que l'on nomme rapidement "marchés" pour moins les distinguer.

Voici de nouveaux éléments pour mieux illustrer cette guerre :


En 6 mois, les hedge funds US ont retiré leurs placements en France et Allemagne (DEU) pour les placer au Canada et au Japon. La rapidité de ce retrait, qu'aucune raison strictement économique n'imposait, devait entrainer un assèchement des capacités de financement en France, et de la une récession. 

Six mois après ce sont les taux interbancaires de la zone Euro qui sont érodés, par des recherches de liquidités à toujours plus court terme par les banques. 

Prochains éléments à surveiller dans les mois à venir : 

1) l'évolution trimestrielle des prêts internationaux consolidés des banques françaises (créances consolidées), avec ventilation par pays sur lequel repose le risque final. 
La proportion des origines des risques est la suivante, pour fin décembre 2011 (source Banque de France, T4 2011, date de dernière publication : 25/04/2012) :

  • total des encours en risque ultime ; Créances sur l'étranger des banques à capitaux français : 2729033 M$
  • dont zone euro : 44,4%
  • paradis fiscaux : 2,1%
  • UK+US+paradis : 29,4%
  • BRICS : 4,9%

2) l'évolution trimestrielle des engagements passifs (Encours de prêts ou de dépôts) des banques françaises ventilés par pays : fin décembre 2011, ce montant pour les Etats-Unis avait en 6 mois diminué de 55% pour retomber au niveau de septembre 2004 ! A la fin de l'année dernière, les engagements vis à vis de US et UK représentaient encore 41% du total.
(source Banque de France, T4 2011, date de dernière publication : 25/04/2012).

Ces tendances peuvent se retrouver parmi tous les pays de la zone euro qui ont été attaqués depuis fin 2009. 

Notre anticipation est que l'imbrication financière réciproque entre US+UK et la zone euro va aller en diminuant rapidement, ce qui va rendre les attaques des "marchés" (...) sur la zone euro progressivement  moins efficaces. Le plus dur a déjà été fait depuis fin 2009, et la prise de conscience collective de la nécessité  politique absolue d'une intégration accélérée de la zone euro. Maintenant nous avons une bonne feuille de route depuis fin le sommet européen de fin juin 2012 (même si il reste encore à y développer le volet social et démocratique). Je vous en parlerai à la rentrée.

Bons devoirs de vacances !

2012/07/13

Where is the budget, there is the power

 There is a long and broad debate in the U.S. about the military spending, and specially this year because of the "Fiscal Cliff". But there is so little debate about the U.S. national security concept, and how it transforms a whole society. This is yet the true nature of things behind such a choice of governments. We have wrote a compilation of texts on this historical perspective.

The growth over time of the Defense budget (FDEFX graph below) is indeed astonishing :

Yes, but the overall federal budget has increased a lot in the same time :


So, let's calculate the percentage of Defense spending over the federal net outlays, and it's history :


Please note the bottom line is 20%, not 0%. This casts a new light on the Korean and Cold Wars.
We must also look with attention to the spending included and not included into FDEFX. And add some defense budget effort taken on Discretionary Budget after votes of the Congress (around 20% of this budget nowadays). We could then be around 30% of the overall budget nowadays.

Most of the time you will find military spendings only used as percentages of GDP, but this blurs the current absolute heavy weight of the U.S. :


I think the part of military spending in the overall budget is much more representative of the real powers in the country. When the federal government is seeking to cut some budgets to reduce expenditures, the real powers behind the scenes appear in direct light, like another political party. Deficit reduction and the automatic cuts scheduled to take effect in January 2013 are viewed as likely to figure in the autumn 2012 US presidential election, but the Congress can attempt at any time to cancel the $1.2 trillion sequester. The real strength of US democracy will effectively be challenged during these times, and the true powers of US deep state could emerge for everyone.

But wait : this Defense budget is financed mostly by debt emission, and at a large extent with US Treasury. Surely the FED is since few years the biggest holder of US Treasury, but many countries also hold them. Their citizens could insist on selling their assets in US Treasury, or even stop buy them and buy instead more... euro-denominated assets for instance.

Update 10/23 :
As anticipated, true powers of US have emerged clearly now for everyone : few hours ago, Obama and Romney have agreed to not cut Defense budget, or even to increase it. New law will be passed before Jan, 2 to modify 2011 Budget Control Act and currently planned military sequester.
Both candidates agree on this very fundamental topic. Because of this, remaining parts of the debate, and thus democracy in the US, is just a farce.

Update 12/3 :
[Add links into the introductory paragraph, and graphics below from our U.S. Debt's dashboard ]

  • U.S. Defense spending history (% GDP), using chained (2003) dollars, from 1910 to 2007 :

  • U.S. Defense spending history (% GDP), 1792-2015 :
A budget reflecting the never-ending war since 1940

  • Percentage of defense spending over the federal expenditures, history from 1946 :
% of defense spending : green line; right hand scale; quaterly updated